At each meeting, the Audit Committee meets in executive session (i.e.(i.e., without management present) with representatives of PwC to discuss the results of their examinations and their evaluations of our internal controls and overall financial reporting. Similar executive sessions are held at least semi-annually with representatives of E&Y.EY. In addition, the Audit Committee meets regularly with certain members of senior management in separate sessions.
Based on the review and discussions referred to above, and in reliance on the information, opinions, reports or statements presented to the Audit Committee by our Company’s management and PwC, the Audit Committee recommended to the Board of Directors that the December 31,
20192021 audited consolidated financial statements be included in our Company’s Annual Report on
Form 10-K.The foregoing report has been approved by the Audit Committee.
Bonnie L. Howard, Chair
G. Lawrence Buhl
ChairmanThomas W. Jones
Michelle McCloskey
Michael T. O'Kane
Courtney C. Shea
29 Assured Guaranty 2022 Proxy Statement
EXECUTIVE COMPENSATION
COMPENSATION DISCUSSION AND ANALYSIS
CD&A ROADMAP
| | | | | |
Summary _______________________________ | 31 |
| 2021 Achievements Highlights _____________ | 31 |
| Our Total Shareholder Return _____________ | 33 |
| 2021 Results Against Financial Performance Targets _____________________________ | 35 |
| Snapshot of Our CEO’s 2021 Compensation _ | 35 |
| |
Executive Compensation Program Structure and Process __________________________ | 36 |
| Overview of Philosophy and Design ________ | 36 |
| Shareholder Outreach on Our Executive Compensation Program ________________ | 38 |
| The Decision-Making Process _____________ | 39 |
| Components of Our Executive Compensation Program ____________________________ | 40 |
| |
CEO Performance Review _________________ | 48 |
| Overview ______________________________ | 48 |
| Base Salary ___________________________ | 49 |
| Cash Incentive _________________________ | 49 |
| Equity Compensation ____________________ | 55 |
| Perquisites ____________________________ | 56 |
| |
Other Named Executive Officer Compensation Decisions ____________________________ | 56 |
| Non-Financial Objectives and Achievements of the Other Named Executive Officers ____ | 56 |
| | | | | |
| |
| Compensation Decisions for the Other Named Executive Officers _______________________ | 58 |
| |
Separation Agreement ______________________ | 59 |
2021 Executive Compensation Conclusion______ | 60 |
Compensation Governance __________________ | 60 |
| The Role of the Board’s Compensation Committee _____________________________ | 60 |
| The Role of the Independent Consultants ______ | 60 |
| Executive Compensation Comparison Group ___ | 61 |
| Executive Officer Recoupment Policy and Related Forfeiture and Termination for Cause Provisions _____________________________ | 61 |
| Share Ownership Guidelines ________________ | 62 |
| Anti-Hedging Policy _______________________ | 63 |
| Anti-Pledging Policy _______________________ | 63 |
| Award Timing ____________________________ | 63 |
| |
Post-Employment Compensation _____________ | 64 |
| Retirement Benefits _______________________ | 64 |
| Severance ______________________________ | 64 |
| Change in Control Benefits _________________ | 64 |
| |
Tax Treatment _____________________________ | 64 |
Non-GAAP Financial Measures _______________ | 65 |
30 Assured Guaranty 2022 Proxy Statement
SUMMARY
Our executive compensation program is designed to attract and retain talented and experienced business leaders who drive our corporate strategies and build long-term shareholder value.
The Compensation Committee assesses performance using pre-established measures of success that are tied to our key business strategies. This approach encourages balanced performance, measured relative to financial and non-financial goals as well as measures of shareholder value, and discourages excessive risk taking or undue leverage by avoiding too much emphasis on any one metric, or on short-term results.
In 2021 we exceeded all but one of the six financial performance targets set by our Compensation Committee at the beginning of the year, in each case also exceeding prior year performance. We also enjoyed substantial success in achieving the non-financial goals set by our Compensation Committee at the beginning of the year.
2021 Achievement Highlights
More than five years of difficult and complex negotiation and litigation over defaulted insured Puerto Rico exposures finally bore fruit in 2021. We completed two plan support agreements with the Federal Oversight Management Board for Puerto Rico and other important stakeholders in 2021, covering 74% of the Puerto Rico debt outstanding on December 31, 2021. This led directly to to the resolution just last week of a significant portion of our insurance exposure to Puerto Rico -- approximately $1.3 billion of net par outstanding at December 31, 2021. With the resolution of our Puerto Rico exposures so much more likely when we closed our books for the year, we were able to take a benefit against our expected losses related to Puerto Rico that was the primary driver of the $204 million economic benefit against our expected losses in the public finance sector.
Similarly, more than a decade of hard work with servicers in our legacy residential mortgage backed securities (which we refer to as RMBS) portfolio to encourage the servicers to keep borrowers in their homes through modifications and forbearances and to maintain liens on the homes continued to pay off in 2021 as ongoing home price appreciation improved expected recoveries and performance of our insured RMBS portfolio, which, over the year, resulted in an economic benefit against our expected losses of $100 million.
Together, the many-years-long loss mitigation efforts for our Puerto Rico and legacy RMBS exposures contributed substantially to our 2021 net income of $389 million and our 2021 adjusted operating income* of $470 million, or $5.23 and $6.32 per share, respectively. Our 2021 net income per share increased by nearly 25% from 2020, and our 2021 adjusted operating income per share more than doubled from 2020. By year-end 2021, our shareholders’ equity attributable to Assured Guaranty Ltd. per share, adjusted operating shareholder’s equity* per share and adjusted book value* per share all reached record levels, at $93.19, $88.73 and $130.67, respectively. Our share price rose 59.4% from $31.49 at year-end 2020 to $50.20 at year-end 2021.
These results were driven in part by our successful pursuit of all of our primary business strategies:
| | |
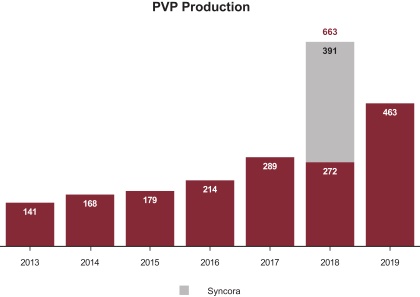
We achieved robust new business production in our insurance segment despite historically low interest rates, with contributions from our U.S. public finance, non-U.S. public finance (including infrastructure) and global structured finance business. •Gross written premiums were $377 million, while our new business production in the insurance segment, a non-GAAP financial measure we refer to as PVP,* was $366 million. •In U.S. public finance, our primary insurance market, we insured 5.0% of par issued out of the entire U.S. new issue municipal market, up substantially from 4.4% in 2020, and the most since 2011. With a more than 60% share of new-issue insured par, we led the municipal bond insurance industry to its highest market penetration in a dozen years. •Also in the U.S. public finance market, we insured 48 transactions with over $100 million of par, more than in any full year over the past decade and a nearly 25% increase from the 39 such transactions we insured in 2020. (We focus on such transactions as a good barometer of institutional demand for our product.) •In the non-U.S. public finance market, we generated $79 million of PVP. •In the structured finance market, we produced nearly $47 million of PVP, the second-highest PVP in over a decade (excluding a portfolio reinsurance transaction). |
* Adjusted operating shareholder’s equity, adjusted book value, adjusted operating income and PVP are non-GAAP financial measures. An explanation of these measures, which are considered when setting compensation for our senior leadership team, and a reconciliation to the most comparable GAAP measures, may be found on pages 102 to 106 of our Annual Report on Form 10-K for the year ended December 31, 2021.
31 Assured Guaranty 2022 Proxy Statement
| | |
We continued to develop our Assured Investment Management (AssuredIM) brand. •Despite the COVID-19 pandemic, we raised $3.0 billion of inflows of third-party AUM. •We issued $2.6 billion in new collateralized loan obligations, which we refer to as CLOs. •As a result of both inflows of third-party AUM and ending certain rebates, we increased our fee-earning assets under management by 28%. •In addition, we are using the knowledge base and experience of AssuredIM to expand the categories and types of investments included in our investment portfolio. Capital invested in AssuredIM funds generated $80 million in pretax equity in earnings, nearly double the $42 million generated in 2020, and representing a blended return of 20.8% in 2021. |
| | |
We further managed our capital, by returning excess capital to our shareholders and by reducing the average coupon on $600 million of long-dated debt by issuing new debt. •We returned approximately $562 million during 2021 through repurchasing Common Shares ($496 million) and distributing dividends ($66 million). •Over the last nine years, we have distributed approximately $4.8 billion to our shareholders through Common Share repurchases and dividends; and we have repurchased approximately 68% of our Common Shares outstanding at December 31, 2012, which was just before we began our Common Share repurchase program. In 2021 alone, we repurchased approximately 14% of the Common Shares we had outstanding at the beginning of 2021. •We issued $500 million of 10-year Senior Notes at a rate of 3.15% in May and issued $400 million of 30-year Senior Notes at a rate of 3.6% in August. Most of the proceeds of these debt offerings were used to redeem $600 million of long-dated debt obligations, and the remaining proceeds were used primarily for share repurchases. We reduced the average coupon on $600 million of our debt from 5.89% to 3.35%. |
We achieved these results despite a persistently challenging business environment.
•The uncertainty and travel and face-to-face meeting restrictions caused by the continuing COVID-19 pandemic made it more difficult to conduct business in some of our markets.
•Over the last several years, municipal bond yields have been at historically low levels, making our insurance product less attractive to issuers. The 30-year AAA Municipal Market Data (MMD) rate is a measure of interest rates in the Company’s largest financial guaranty insurance market, U.S. public finance. The 30-year AAA MMD rate started 2021 at 1.39% and remained mostly steady ending the year at 1.49%. The average rate for the year was 1.54%, below the 1.71% average for the prior year and a new historical low. The level of interest rates influences how high a premium our Company can charge for our financial guaranty insurance product, with lower interest rates generally lowering the premium rates we may charge.
•The difference, or credit spread, between the 30-year A-rated General Obligation (GO) relative to the 30-year AAA MMD averaged 33 basis points, which we refer to as bps, in 2021--down from 42 bps in 2020. BBB credit spreads measured on the same basis averaged 70 bps in 2021, significantly tighter than the 121 bps average in 2020. Both the A and BBB credit spreads are at their narrowest levels in over a decade. A narrower credit spread is one factor that may restrict the level of premiums our Company can charge for our financial guaranty insurance product.
•We also continued to face pricing competition in certain segments of the financial guaranty market from another financial guaranty insurer that serves a smaller portion of the market than we serve.
The achievements described in this section even in the face of this environment were important considerations for the Compensation Committee in determining the compensation of our named executive officers for the 2021 performance year.
32 Assured Guaranty 2022 Proxy Statement
Our Total Shareholder Return
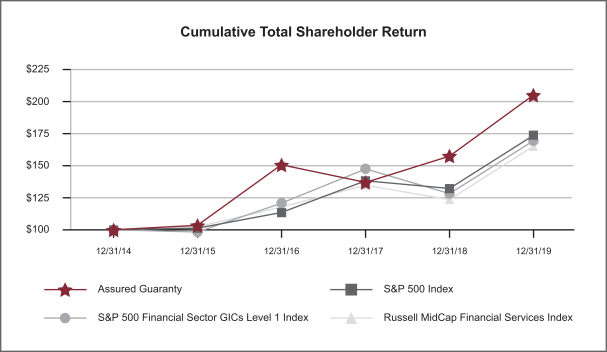
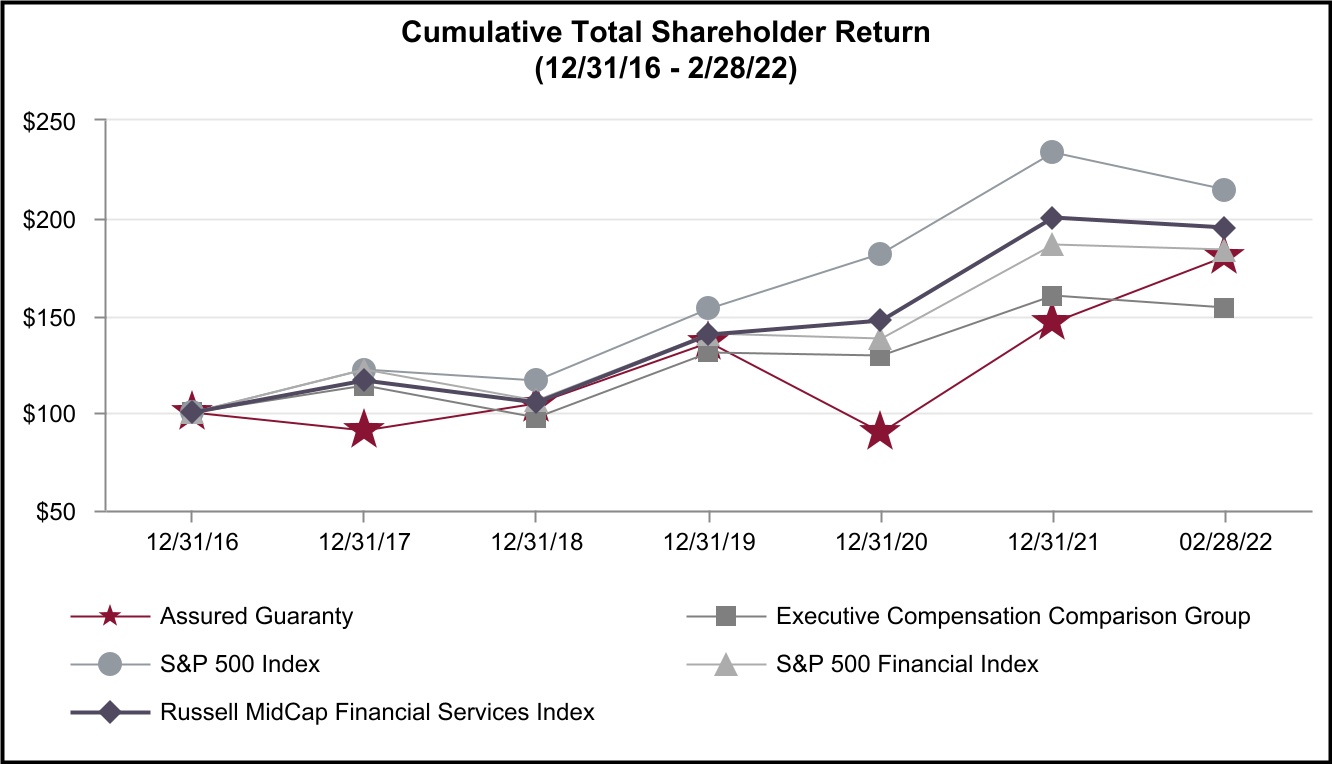
The table and chart below depict the cumulative TSR in dollars on our Common Shares from December 31, 2016 through February 28, 2022, relative to the cumulative TSR of the Russell Midcap Financial Services Index, S&P 500 Stock Index, S&P 500 Financials Index and our current executive compensation comparison group over the same period. (Our current executive compensation comparison group is described below under “Compensation Governance—Executive Compensation Comparison Group.”) The table and chart depict the value on December 31 of each year from 2016 through 2021, and on February 28, 2022, of a $100 investment made on December 31, 2016, with all dividends reinvested.
Our Compensation Committee has long recognized that, as the only public company still writing financial guaranty business, it is difficult for us to identify companies or indices with companies that experience business environments similar to ours, and to which we can compare our performance, including our TSR. For example, developments related to Puerto Rico appear to have had a much larger influence on our TSR than on that of any of the indices or groups to which we compare ourselves. We have substantial insured exposure to general obligation bonds of the Commonwealth of Puerto Rico and various obligations of its related authorities and public corporations. Many of these entities have defaulted on their payment obligations, and we are paying claims related to such payment defaults. We believe that developments relating to our Puerto Rico exposure have had a strong influence on the price of our shares. This appears to have contributed to volatility of our share price. On January 18, 2022, the plan of adjustment covering $1.2 billion, or 34% of our insured net par outstanding of Puerto Rico exposures as of December 31, 2021, was approved. Then, on January 20, 2022, orders were entered finalizing the consensual modification for another $168 million of our insured Puerto Rico exposure outstanding as of December 31, 2021. On February 24, 2022, we announced in our earnings release the impact of these developments on our 2021 consolidated financial statements. We believe it is instructive to look at the TSR measurements not only at December 31 of each year, but also at February 28, 2022 (the last trading day in February), when the price of our shares reflected the impact of 2021 developments related to Puerto Rico announced on February 25, 2022. As can be seen, when measured through February 28, 2022, our TSR essentially kept pace with most of the financial indices to which we compare ourselves, and exceeded our current executive compensation comparison group by nearly 50%.
Calculated from total returns published by Bloomberg.
33 Assured Guaranty 2022 Proxy Statement
| | | | | | | | | | | | | | | | | |
Cumulative TSR from 12/31/16 | Assured
Guaranty | Executive Compensation Comparison Group | S&P 500
Index | S&P 500
Financials Index | Russell MidCap Financial Services Index |
| 12/31/2016 | 100.00 | 100.00 | 100.00 | 100.00 | 100.00 |
| 12/31/2017 | 90.96 | 114.10 | 121.82 | 122.14 | 116.62 |
| 12/31/2018 | 104.56 | 97.49 | 116.47 | 106.21 | 104.91 |
| 12/31/2019 | 136.07 | 130.66 | 153.13 | 140.30 | 140.11 |
| 12/31/2020 | 89.89 | 129.22 | 181.29 | 137.83 | 147.03 |
| 12/31/2021 | 145.94 | 160.02 | 233.28 | 185.90 | 199.75 |
| 02/28/2022 | 180.15 | 153.76 | 214.58 | 183.48 | 194.82 |
Calculated from total returns published by Bloomberg.
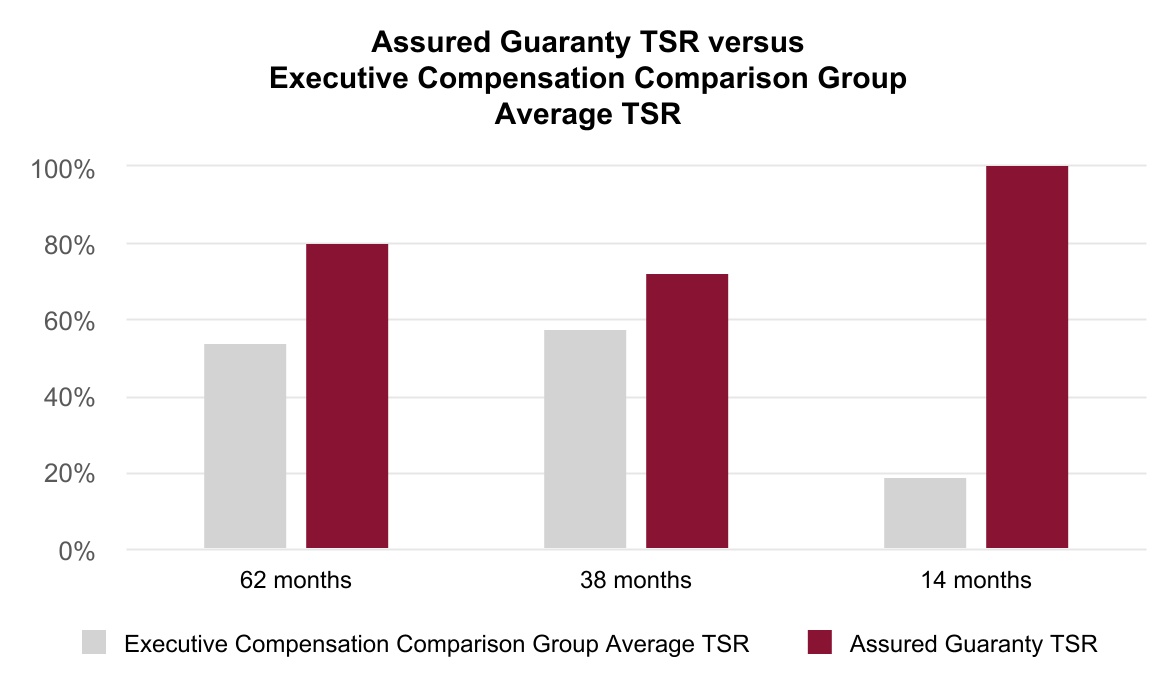
The chart and table above compare our TSR based on a start date of December 31, 2016. Another way to compare our TSR to our current executive compensation comparison group is to examine how our TSR compares over various periods ending on February 28, 2022, after the price of our shares reflected the impact on our financial statements of our 2021 accomplishments. (Our current executive compensation comparison group is described below under “Compensation Governance—Executive Compensation Comparison Group.”) The chart and table below show our cumulative TSR over the previous 14 months, 38 months and 62 months, with an end date of February 28, 2022, compared to that of our current executive compensation comparison group. On this basis, our TSR is more than five times that of our current executive compensation comparison group over the previous 14 months, and materially exceeds that of our current executive compensation comparison group over 38 months and 62 months.
Total Shareholder Return Comparison
| | | | | | | | |
| Period Ending 02/28/2022 | Executive Compensation Comparison Group Average TSR | Assured Guaranty TSR |
| 14 months | 18.99% | 100.42% |
| 38 months | 57.72% | 72.29% |
| 62 months | 53.76% | 80.15% |
| Calculated from total returns published by Bloomberg. |
34 Assured Guaranty 2022 Proxy Statement
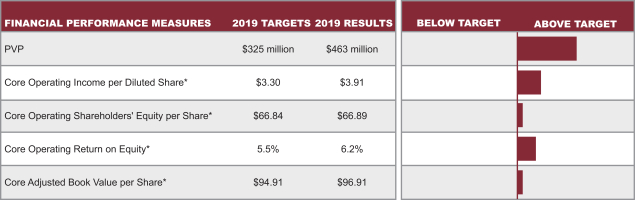
2021 Results Against Financial Performance Targets
We exceeded all but one of the six 2021 financial performance targets set by the Compensation Committee at the beginning of the year, and in each of those instances exceeded the 2020 actual results. The table below summarizes our 2021 results against the 2021 targets for the financial performance measures. The financial performance measurements are explained in more detail below under “Executive Compensation Program Structure and Process—Components of Our Executive Compensation Program—Cash Incentive Compensation”.
| | | | | | | | | | | | | | | | | | | | | | | | | | | | | | | | | | | | | | | | | | | | | | | | | | | | | | | | | | | | | | | | | | | | | | | | | | | | | | | | | | | | | | | | | | | | | | | | | | | | | | | | | | | | | | | | | | | | | | | | | | | | | | | | | | | |
| FINANCIAL PERFORMANCE MEASURES | 2021 TARGETS | 2021 RESULTS | | BELOW TARGET | ABOVE TARGET |
| | | | | | | | | | | | | | | | | | | | | | | | | | | | | | | | | | | | | | | | | | | |
| Core Operating Income per Diluted Share* | $3.62 | $5.91 | | | | | | | | | | | | | | | | | | | | | | | | | | | | | | | | | | | | | | | | | |
| | | | | | | | | | | | | | | | | | | | | | | | | | | | | | | | | | | | | | | | | | | |
| | | | | | | | | | | | | | | | | | | | | | | | | | | | | | | | | | | | | | | | | | | |
| Core Operating Return on Equity* | 4.6% | 7.3% | | | | | | | | | | | | | | | | | | | | | | | | | | | | | | | | | | | | | | | | | |
| | | | | | | | | | | | | | | | | | | | | | | | | | | | | | | | | | | | | | | | | | | |
| | | | | | | | | | | | | | | | | | | | | | | | | | | | | | | | | | | | | | | | | | | |
| Core Operating Shareholders’ Equity per Share* | $82.90 | $88.26 | | | | | | | | | | | | | | | | | | | | | | | | | | | | | | | | | | | | | | | | | |
| | | | | | | | | | | | | | | | | | | | | | | | | | | | | | | | | | | | | | | | | | | |
| | | | | | | | | | | | | | | | | | | | | | | | | | | | | | | | | | | | | | | | | | | |
| Core Adjusted Book Value per Share* | $122.60 | $130.33 | | | | | | | | | | | | | | | | | | | | | | | | | | | | | | | | | | | | | | | | | |
| | | | | | | | | | | | | | | | | | | | | | | | | | | | | | | | | | | | | | | | | | | |
| | | | | | | | | | | | | | | | | | | | | | | | | | | | | | | | | | | | | | | | | | | |
| PVP | $475 million | $361 million | | | | | | | | | | | | | | | | | | | | | | | | | | | | | | | | | | | | | | | | | |
| | | | | | | | | | | | | | | | | | | | | | | | | | | | | | | | | | | | | | | | | | | |
| | | | | | | | | | | | | | | | | | | | | | | | | | | | | | | | | | | | | | | | | | | |
| Gross Third-Party Assets Raised | $2.7 billion | $3.0 billion | | | | | | | | | | | | | | | | | | | | | | | | | | | | | | | | | | | | | | | | | |
| | | | | | | | | | | | | | | | | | | | | | | | | | | | | | | | | | | | | | | | | | | |
* Five of the six financial targets are based on non-GAAP financial measures and four of the six are labeled “core” to distinguish them from similar non-GAAP financial measures. The four “core” measures have been adjusted to exclude the impact of consolidating certain variable interest entities and similar entities, which we refer to as VIEs, while the similar non-core measures have not been so adjusted. We include below under “Non-GAAP Financial Measures” a description of the adjustments we make to the most comparable GAAP financial measures to arrive at these measures.
Snapshot of Our CEO’s 2021 Compensation
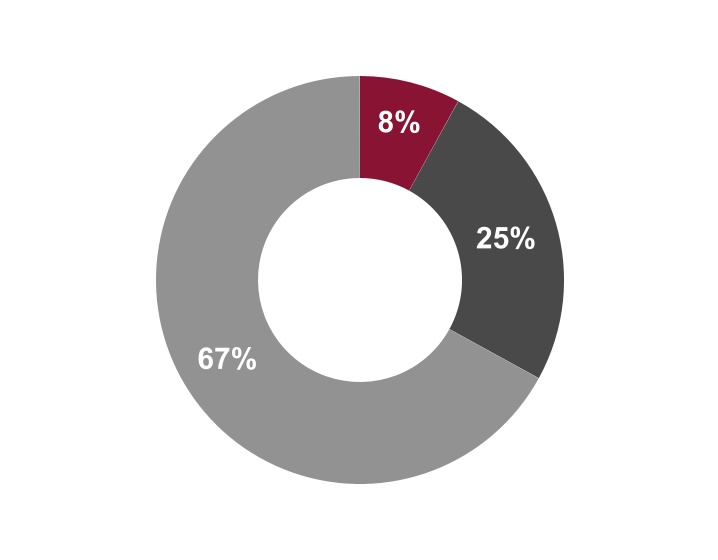
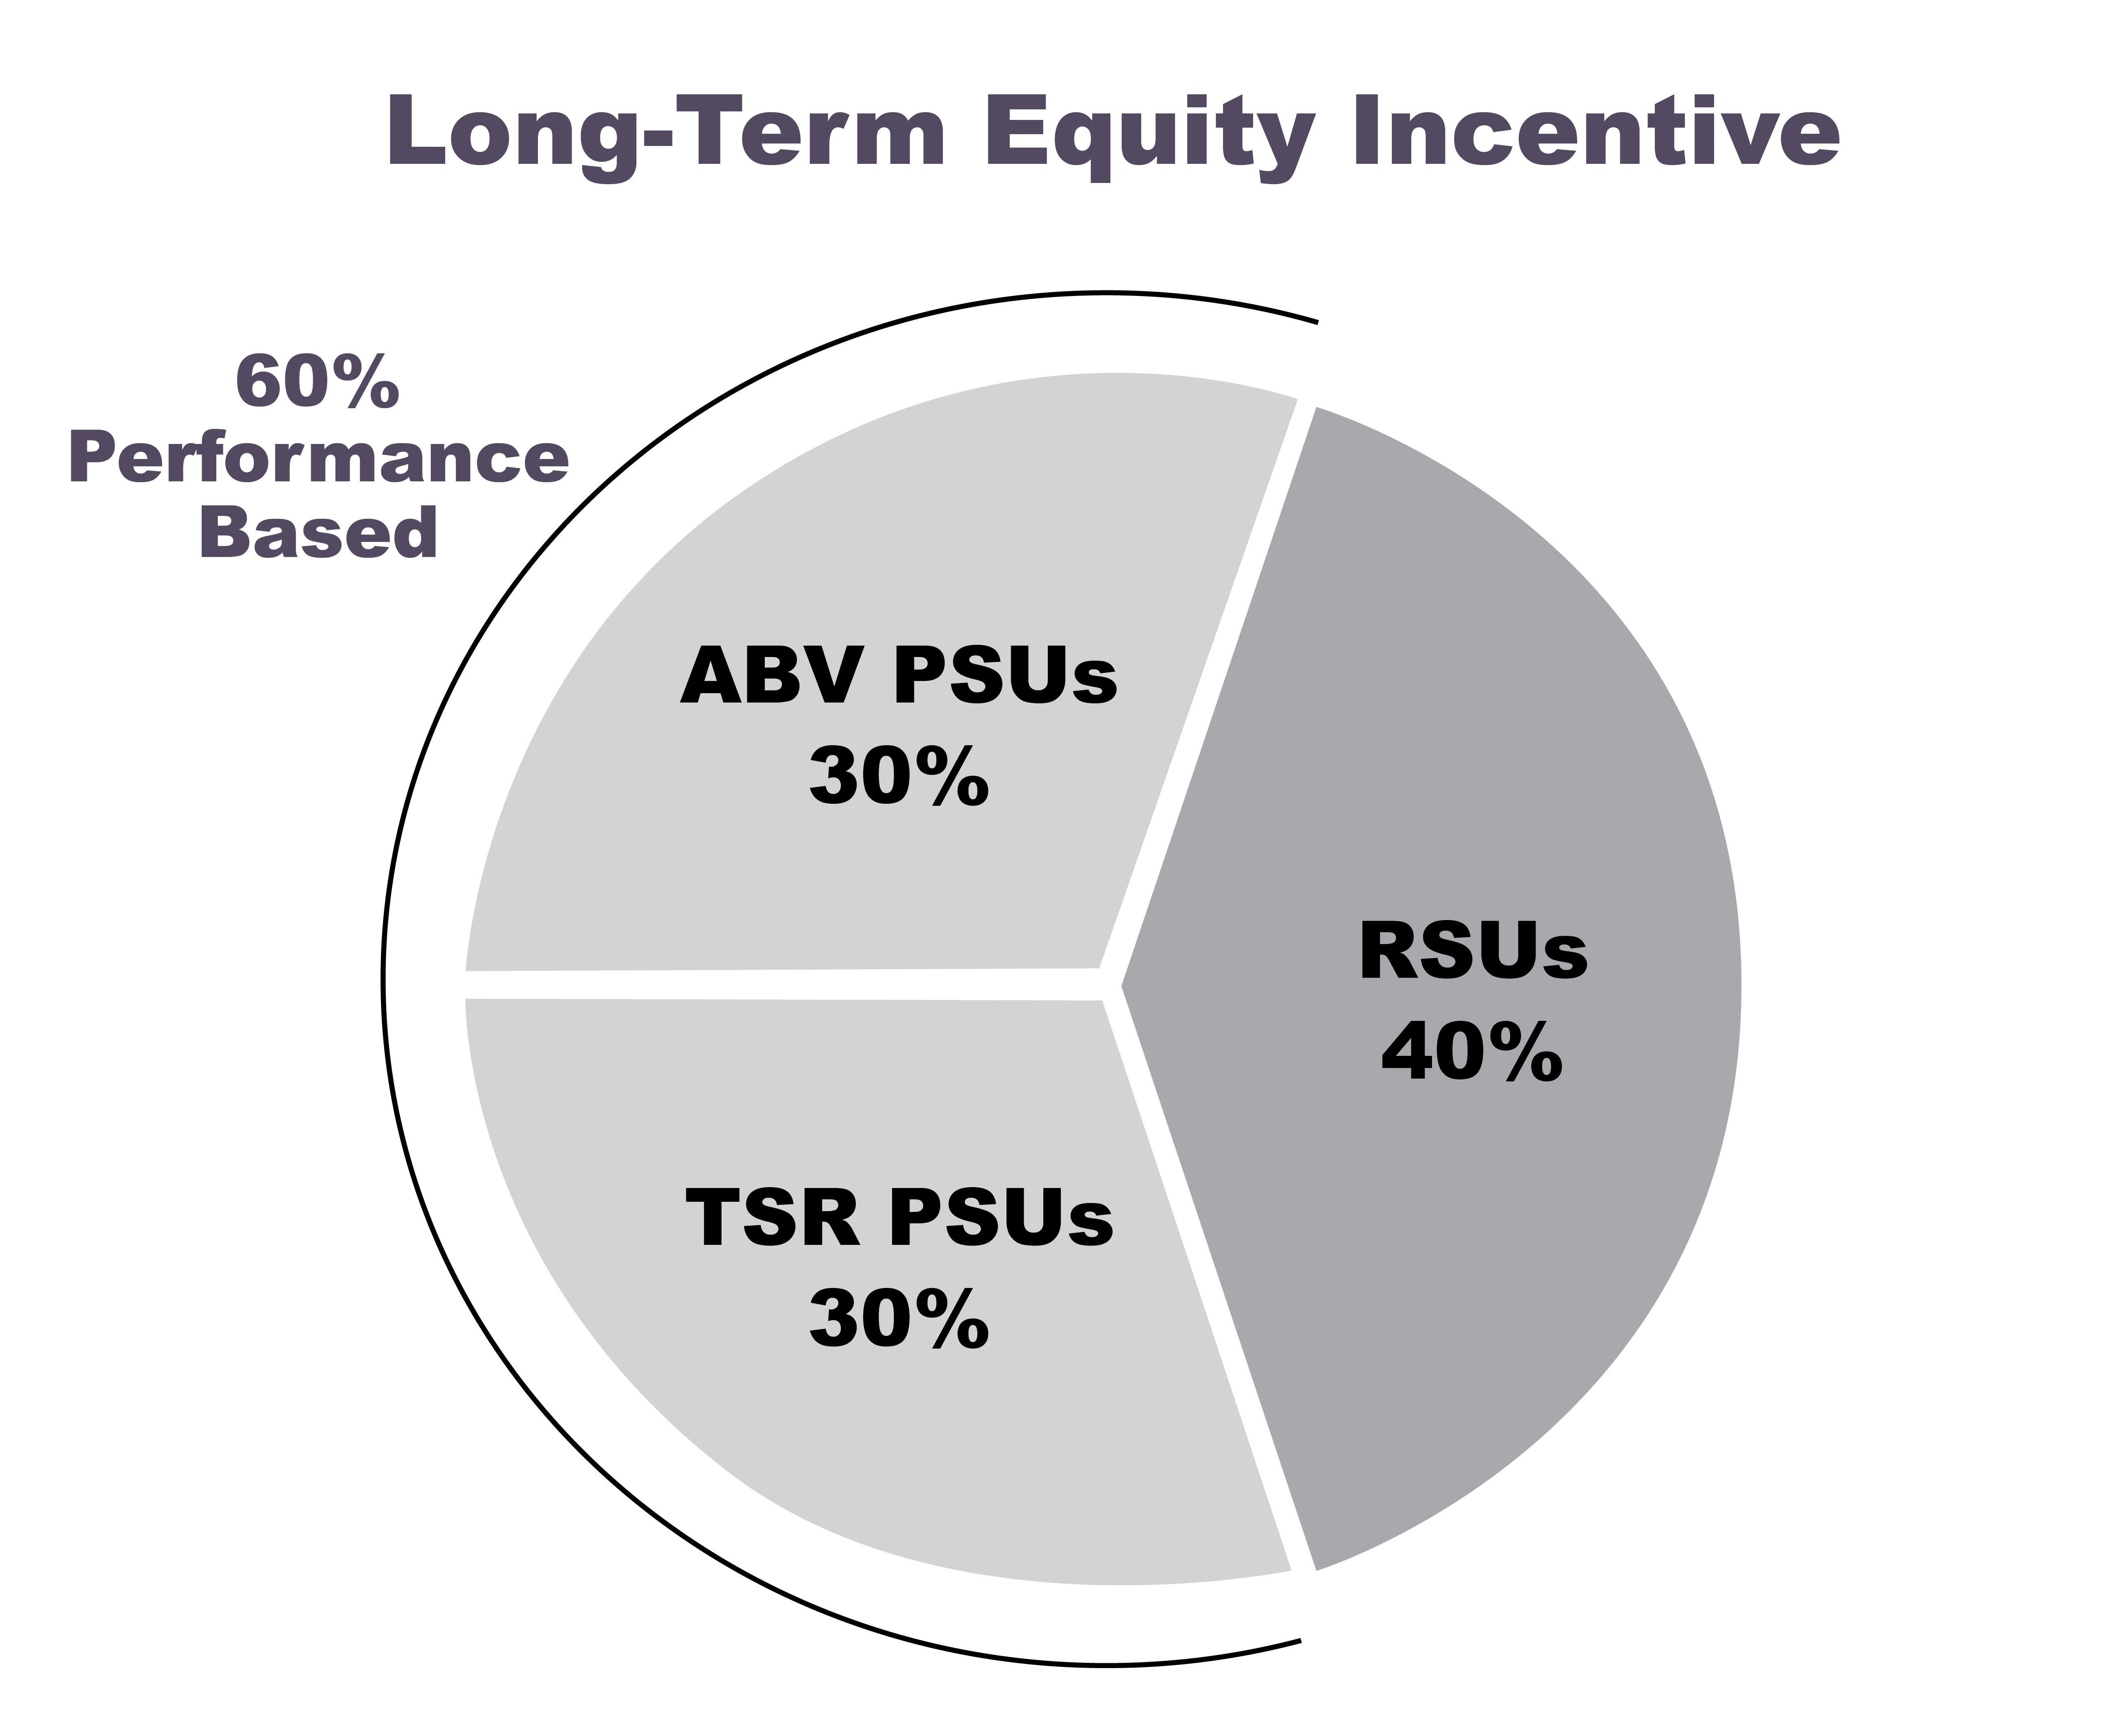
For 2021, 89.5% of Mr. Frederico’s compensation constituted incentive compensation: 28.9% of his compensation was in the form of a performance-based cash incentive that was awarded based on measuring his performance against financial performance targets and non-financial objectives set at the beginning of the year, and 60.6% was in the form of a long-term equity-based incentive, with 60% of that equity award dependent on performance relative to our pre-established objectives for 2022 to 2024. The allocation between his fixed and incentive compensation for the 2021 performance year increased to 89.5% incentive compensation from 88.9% for the 2020 performance year.
Mr. Frederico received a compensation package for the 2021 performance year that was 6.5% higher than the one he received for the 2020 performance year, reflecting our strong financial and share price performance and the achievement of non-financial strategic objectives that position us for future growth and our successful transformation into a financial services company with a dual focus on financial guaranty and asset management. The increase should also be viewed in the context of Mr. Frederico's compensation package for the 2020 performance year being 4.2% lower than the one he received for the 2019 performance year, and his 2021 compensation package being only 1.9% higher than his 2019 compensation package.
•Mr. Frederico’s cash incentive compensation increased by 16.0% from the prior year, largely as a function of the financial performance goal scores awarded by the Compensation Committee. As a result of meeting all but one of the six financial performance targets set by the Compensation Committee, the Compensation Committee awarded Mr. Frederico a weighted score on his financial performance targets of 82.1%, considerably above his score of 61.4% for 2020, when only three of the six financial performance targets were met. The Compensation Committee awarded him a similar weighted score on his non-financial objectives for 2021, 56.1% for 2021 compared to 57.8% for 2020. Mr. Frederico’s total achievement score for 2021 was 138.2%, substantially above his score of 119.2% for 2020, but still below his total achievement score of 149.1% for 2019.
•The Compensation Committee considered the appropriate amount of long-term incentive equity compensation to award Mr. Frederico in recognition of our significant achievements despite the continued disruption of COVID-19 and the extraordinarily low interest rates of 2021. In recognition of these accomplishments and the Compensation Committee’s strong desire that Mr. Frederico continue his leadership as we transform our Company into a more diversified financial services company with a dual focus on financial guaranty insurance and asset management, the Compensation Committee granted Mr. Frederico long-term equity compensation with a target nominal value of $7,250,000, an increase of $250,000 from his grant for the 2020 performance year.
35 Assured Guaranty 2022 Proxy Statement
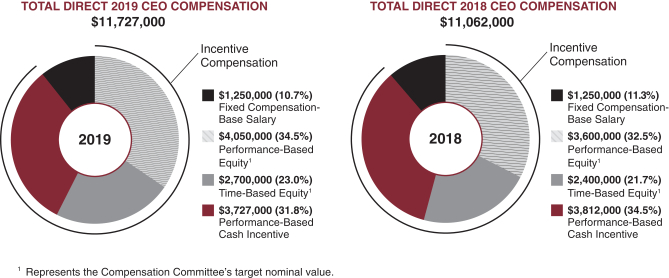
Mr. Frederico’s compensation package for 2021, 2020 and 2019 were composed of the following:
| | | | | |
| n | Performance-Based Equity1 |
| n | Time-Based Equity1 |
| n | Performance-Based Cash Incentive |
| n | Fixed Compensation-Base Salary |
| | | | | | | | | | | | | | | | | | | | |
| 2021 Performance Year Compensation | 2020 Performance Year Compensation | Change from
2020 to 2021
Perf. Year |
Fixed Compensation—Base Salary (1) | $ 1,250,000 | | $ 1,250,000 | | — | % |
| Incentive Compensation | | | | | | |
| Cash Incentive Compensation | $ 3,454,988 | | $ 2,979,625 | | 16.0 | % |
| Long-Term Performance-Based Equity | $ 4,350,000 | (2) | $ 4,200,000 | (2) | 3.6 | % |
| Long-Term Time-Based Equity | $ 2,900,000 | (2) | $ 2,800,000 | (2) | 3.6 | % |
| Total Direct Compensation | $11,954,988 | | $11,229,625 | | 6.5 | % |
(1) Mr. Frederico’s base salary for each of the 2021 and 2020 performance years was established at the beginning of such performance year, in February. Accordingly, Mr. Frederico’s 2021 base salary was established in February 2021.
(2) Represents the Compensation Committee’s target nominal value for the relevant performance year. The number of units granted is calculated by dividing such value by the average closing price on the NYSE of a Common Share over the 40 consecutive trading days ending on the date of grant.
The compensation package presented in the table above is different from the SEC-required disclosure in the Summary Compensation Table below and is not a substitute for the information in that table. Rather, it is intended to show how the Compensation Committee linked Mr. Frederico’s compensation and its components to our performance results and his achievements for the prior year.
EXECUTIVE COMPENSATION PROGRAM STRUCTURE AND PROCESS
Overview of Philosophy and Design
Our executive compensation program applies to our CEO, each of our other executive officers, and our other senior managers reporting directly to our CEO, all of whom together we refer to as our senior leadership team. Our executive compensation program is designed to recognize and reward outstanding achievement and to attract, retain and motivate the talented individuals needed to lead and grow our Company’s business. We maintain an ongoing dialog with our shareholders and incorporate their feedback into our program so that the program is aligned with their interests.
36 Assured Guaranty 2022 Proxy Statement
The guiding principles of our program are:
| | | | | | | | | | | |
| Pay for Performance | Accountability | Alignment | Retention |
by providing an incentive for exceptional performance and the possibility of reduced compensation if executives are unable to successfully execute our strategies | for short- and long- term performance | with shareholder interests | of highly qualified executives with financial guaranty and asset management experience |
We Align Pay With Performance
Our program rewards the performance of our senior leadership team, who are directly responsible for our operational results, with a higher proportion of variable and performance-based compensation than it rewards lower level executives. We use a mix of variable at-risk compensation with different time horizons and payout forms to provide an incentive for both annual and long-term sustained performance, in order to maximize shareholder value in a manner consistent with our Company’s risk parameters. The Compensation Committee assesses the performance of our senior leadership team from both a financial and a non-financial perspective, using pre-established goals.
Members of our senior leadership team are eligible to receive an annual cash incentive, which is based on their performance against pre-established goals over the previous year. They may also receive a long-term equity incentive, the majority of which is performance-based and cliff vests at the end of a three-year performance period, and the remainder of which is time-based and cliff vests at the end of a three-year period. The long-term equity incentive is structured to encourage retention and a long-range mindset.
Executive Compensation Is Closely Tied To Long-Term Performance
The compensation program is structured with upside potential for superior executive achievements, but also the possibility of reduced compensation if members of our senior leadership team do not successfully execute our Company’s strategies. By increasing our senior leadership team’s motivation to enhance shareholder value over the long term, our compensation program aligns their incentives and shareholder interests.
37 Assured Guaranty 2022 Proxy Statement
For the 2021 performance year, we maintained the same structure for the compensation package for our senior leadership team as we did for the 2020 performance year:
| | | | | |
| Principal Elements of Executive Compensation Package | Purpose |
| Base Salary | Based on responsibilities, skill set and experience, and market measures |
| Cash Incentive Compensation | Cash reward for performance against annual financial performance targets and progress against strategic non-financial objectives that we expect to drive our growth over the medium to long term |
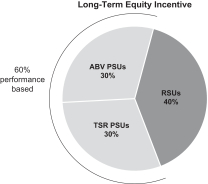
| Equity Incentives | 60% in performance restricted share units, which we refer to as PSUs, that may be earned over a 3-year performance period based on performance targets, and are paid at the end of the 3-year performance period if particular performance targets are achieved, with half of the PSUs (or 30% of the long-term equity incentive) being based on growth in our Core Adjusted Book Value per share, and half of the PSUs (or 30% of the long-term equity incentive) being based on our TSR, relative to the 55th percentile of the Russell Midcap Financial Services Index 40% in restricted share units, which we refer to as RSUs, that cliff vest at the end of a 3-year period |
Shareholder Outreach on Our Executive Compensation Program
For the past several years, we have actively engaged with our shareholders in order to obtain their feedback on our executive compensation program. In May 2018, after negative recommendations from the two leading proxy advisory firms, only 60% of the Common Shares voting approved our say-on-pay proposal. Following that 2018 say-on-pay vote, we sought to engage with our shareholders with respect to the changes we proposed to make to the executive compensation program in response to the recommendations from the two leading proxy advisory firms and the say-on-pay result, and based on advice from FW Cook. As part of that process and our continued dialogue with shareholders, we contacted holders of an aggregate of over 77% of our Common Shares (which comprised every shareholder holding more than 0.16% of our outstanding shares). Based on the feedback from our shareholders and advice from FW Cook, we made a number of structural changes to our executive compensation program in 2019:
•With respect to the short-term cash incentive compensation, we reduced the CEO’s target individual cash multiple to 2.0x from 2.5x and introduced negative discretion for scoring the achievement of financial performance targets that were set below prior year actual results.
•With respect to the long-term equity compensation, we increased the amount dependent on performance measures from 50% to 60% and introduced the two new types of PSUs described above.
•We also ended our reimbursement of executives for the cost of financial planning.
In May 2019, after we made these structural changes to our executive compensation program based on discussions with our shareholders and advice from FW Cook, investors holding over 93% of the Common Shares voting approved our say-on-pay proposal at our Annual General Meeting. Then, in May 2020, and with respect to an unchanged executive compensation program, investors holding over 93% of the Common Shares voting once again approved our say-on-pay proposal at our Annual General Meeting. In light of this positive feedback, we made only one change to our compensation program for the 2020 performance year, adding a new financial performance measure related to our asset management business.
In late 2021 and into early 2022, we again sought to engage with our shareholders with respect to compensation matters. We contacted holders of an aggregate of nearly 85% of our outstanding Common Shares (which comprised every shareholder holding more than 0.1% of our outstanding Common Shares) and offered to discuss our executive compensation program. The holders of approximately 24% of our outstanding Common Shares specifically responded that they did not need to speak with us because they had no concerns about our executive compensation program, which we have not changed from last year except to expand our recoupment policy.
38 Assured Guaranty 2022 Proxy Statement
The Decision-Making Process
Our Compensation Committee, composed solely of independent directors, is responsible for all decisions regarding the compensation of our senior leadership team, including our CEO. Our Compensation Committee works closely with FW Cook, the Chair of our Board and management to examine pay and performance matters throughout the year, and consults with our Board prior to making final compensation decisions.
Our Compensation Committee conducts in-depth reviews of performance and then applies judgment to make compensation decisions. Our Compensation Committee believes its process, described below, is an effective way to assess the performance, risk management and leadership demonstrated by Mr. Frederico and other members of our senior leadership team.
•In August and November, our Compensation Committee reviews our year-to-date performance against our business plan, our financial performance, and the progress of each member of our senior leadership team against individual performance goals.
•In November, our Compensation Committee reviews and approves the metrics and goals in our performance framework and reviews certain performance goals of each member of our senior leadership team for the upcoming year, and begins to formulate its compensation decisions with respect to current year performance. The metrics and goals our Compensation Committee sets in November for the upcoming year are based in part on estimates of the full year performance.
•In February, our Compensation Committee meets twice. It first meets in early February to receive and review our final results and to evaluate the performance of members of our senior leadership team for the previous calendar year, which we refer to as the performance year, against that performance year’s goals. Our Compensation Committee formulates its preliminary compensation decisions for members of the senior leadership team with respect to that year’s performance, along with the performance goals for each member of our senior leadership team for the coming year. Later in February, our Compensation Committee discusses with other Board members its preliminary compensation decisions for the previous year and the performance goals for each member of our senior leadership team for the coming year, and then makes its final decisions with respect to those matters. Our CEO is not present when our Compensation Committee goes into executive session to evaluate his performance and determine his compensation.
39 Assured Guaranty 2022 Proxy Statement
In making its compensation decisions, our Compensation Committee follows a five-step approach:
| | | | | | | | | | | | | | | | | | | | | | | | | | | | | |
| | | | | | | | | |
| | | | | | | | | Step 5: Seek input from the independent consultant concerning CEO pay. Our Compensation Committee considers FW Cook’s analysis of the compensation paid to executive officers in our executive compensation comparison group when evaluating the compensation of our senior leadership team. The role of FW Cook is described in more detail below under “Compensation Governance—the Role of the Independent Consultants.” |
| | | | | | | | |
| | | | | | | Step 4: Analyze trends among comparison companies. Our Compensation Committee considers market pay levels and trends based on information FW Cook provides about comparison companies. | |
| | | | | Step 3: Review the individual performance and contributions of each member of our senior leadership team. Our Compensation Committee reviews the individual performance objectives for our CEO and each other member of our senior leadership team, and assesses each person’s performance and contributions. For the members of our senior leadership team other than our CEO, our Compensation Committee considers individual performance assessments and compensation recommendations from our CEO, as well as succession planning and retention issues in this unique segment of the financial services industry. | |
| | Step 2: Assess Company Performance. Our Compensation Committee reviews our corporate financial performance targets for the performance year and discusses our full-year financial and strategic performance at length, seeking to understand what was accomplished relative to established objectives, how it was accomplished, and the quality of the financial results. | |
Step 1: Establishment of financial performance goalsand non-financial objectives. At or prior to the beginning of each performance year, our Compensation Committee discusses our Company’s business plan at length and establishes corporate financial goals for the upcoming performance year. Our Compensation Committee also discusses the strategic direction of our Company and establishes non-financial objectives it expects to drive our growth over the medium to long term. | |
Components of Our Executive Compensation Program
For the 2021 performance year, the compensation package for our senior leadership team again consists of three principal elements: base salary, cash incentive compensation and long-term equity incentives. Our practice is to review the components of our executive compensation package separately and monitor the total of the various components. We consider each component and the total against our compensation objectives described in “Overview of Philosophy and Design.” Decisions related to one compensation component (e.g., cash incentive compensation) generally do not materially affect decisions regarding any other component (e.g., long-term equity incentives) because the objectives of each element differ. Due to the seniority of the members of our senior leadership team, variable pay elements are emphasized, but no specific formula, schedule or structure is currently applied in establishing the percentage of total compensation delivered to the members of our senior leadership team through any particular compensation element.
Base Salary
Our Compensation Committee establishes the base salary of each member of our senior leadership team in consultation with FW Cook. We believe base salary is necessary to attract and retain key executives by providing appropriate compensation that is based on position, experience, scope of responsibility and performance. Base salary provides liquidity to our each member of our senior leadership team and balances the levels of guaranteed pay with at-risk pay to properly manage our compensation-related risk. The amount is based on the responsibilities, skills and experience of each member of our senior leadership team, as well as market measures. The level of the base salary of each member of our senior leadership team reflects our Compensation Committee’s view of the contribution that executive has consistently made to our Company’s success over several years, the continuing importance of that executive to our Company’s future, and the difficulty and expense of replacing that executive with one of a similar caliber. Our Compensation Committee does not guarantee salary adjustments on an annual basis; in fact, our CEO’s base salary was last adjusted in February 2017. Base salary is set toward the beginning of the year and is paid to each member of our senior leadership team for ongoing performance throughout the year. For the 2021 performance year, our Compensation Committee established the base salaries of our senior leadership team in February 2021.
40 Assured Guaranty 2022 Proxy Statement
Cash Incentive Compensation
Unlike base salary, which is set at the beginning of the year in which it is paid, cash incentive compensation is determined after the end of the performance year to which such compensation relates. For the 2021 performance year, our Compensation Committee determined the amount of the cash incentive compensation in February 2022.
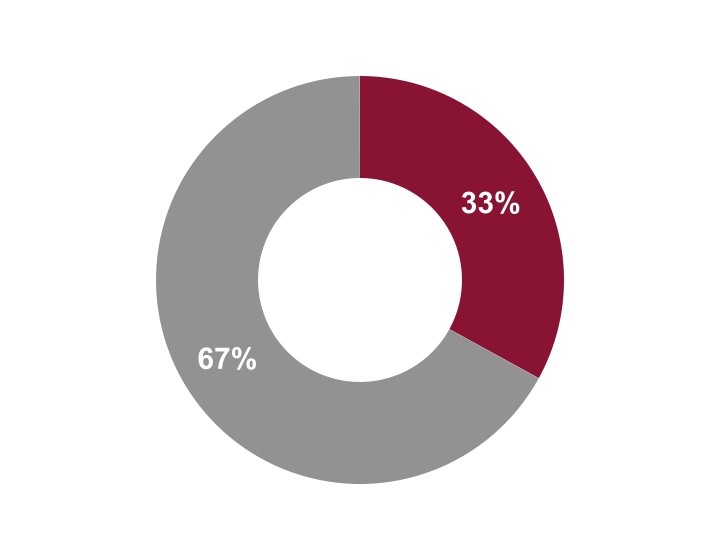
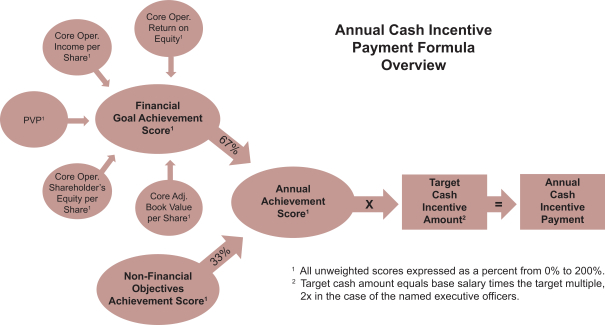
Our Compensation Committee uses a formula to award cash incentive compensation in order to enhance the transparency of our process. The amount of cash incentive compensation is determined based on the extent to which the members of the senior leadership team achieve certain pre-established performance targets; 67% is tied to the achievement of six financial performance targets and 33% is tied to the achievement of non-financial objectives.
Our Compensation Committee considers the six financial performance targets to be important in assessing our Company and the performance of our senior leadership team; for all but one of our named executive officers, each target has a weighting of 11.17% (for a total of 67%). Five of the financial performance targets are based on non-GAAP financial measures that are described below under “Non-GAAP Financial Measures.”
Similar to the financial performance goals, the non-financial objectives also relate to matters that are important to our business. Our Compensation Committee believes the qualitative objectives are necessary to fully evaluate the annual achievements that benefit our shareholders, and it does not individually weight the non-financial objectives because it believes it is more appropriate to evaluate the level of achievement of all of the non-financial objectives in their totality.
We provide a diagram of our formula for awarding our annual cash incentive compensation below:
The financial performance targets for 2021 for all the members of our senior leadership team, including Mr. Frederico, our CEO, are set out below. The non-financial objectives for Mr. Frederico are set out below under “CEO Performance Review—Cash Incentive—Mr. Frederico’s Non-Financial Objectives”, while certain of the non-financial objectives for the named executive officers other than Mr. Frederico are discussed below under “Compensation Decisions of Other Named Executive Officers.” For the 2021 performance year, the financial performance targets and the non-financial objectives for the named executive officers were established in February 2021, and the Compensation Committee determined the extent to which they had been satisfied in February 2022.
Five of the six financial goals are based on non-GAAP financial measures and four of those five are labeled “core” to distinguish them from similar non-GAAP financial measures. The four “core” measures have been adjusted to exclude the impact of consolidating certain variable interest entities and similar entities, which we refer to as VIEs, while the similar non-core measures have not been so adjusted. We include below under “Non-GAAP Financial Measures” a description of the adjustments we make to the most comparable GAAP financial measures to arrive at these measures.
41 Assured Guaranty 2022 Proxy Statement
2021 Financial Performance Measures
| | | | | | | | |
Core operating income per diluted share | | enables us to evaluate the amount of income we are generating in our business without certain items, primarily non-economic fluctuations and movements in fair value, foreign exchange movements related to long dated receivables and payables, and other adjustments, as well as removing the impact of consolidating VIEs. |
| | |
Core operating
ROE | | represents core operating income for a specified period divided by the average of core operating shareholders’ equity at the beginning and the end of that period. This measure enables us to evaluate our return on equity. |
| | |
Core operating shareholders’ equity per share | | presents our equity excluding non-economic fair value adjustments as well as the impact of consolidating VIEs. Core operating shareholders’ equity per share is the basis of the calculation of core adjusted book value, which we refer to as Core ABV, per share, as described below. |
| | |
Core ABV per share | | reflects our core operating shareholders’ equity, plus unearned premiums in excess of expected losses, plus future estimated revenues from contracts other than financial guaranty insurance contracts (such as specialty insurance contracts and credit derivatives), less deferred acquisition costs. This measure enables us to measure our intrinsic value, excluding our franchise value. |
| | |
| PVP | | represents the estimated value of new business production in our insurance segment. PVP takes into account upfront premiums and the present value of estimated future installment premiums using a consistent discount rate on all new contracts written in a reporting period. |
| | |
Gross third-party assets raised | | represents the gross increase in AUM, from sources other than our subsidiaries (but includes assets from employees and former employees). It represents sales of CLOs, as well as gross increases in funded and unfunded commitments in funds managed by AssuredIM, which we refer to as AssuredIM Funds, during the year. Gross third-party assets raised would also include gross third-party assets obtained in strategic transactions. Gross third-party assets raised increases the total AUM on which we earn recurring asset management fees. We also sometimes refer to this measure as inflows of third-party AUM. |
At the beginning of a performance year, our Compensation Committee assigns each member of our senior leadership team an Individual Target Cash Incentive Amount, which is calculated as a multiple of that executive’s base salary, and which we refer to as the Individual Target Cash Incentive Multiple. The amounts of the base salary and Individual Target Cash Incentive Multiples are set based on the executive’s position and level of responsibility, historic pay level, importance to the future strategic direction of our Company and FW Cook’s advice about the compensation practices of companies in our comparison group.
For the 2021 performance year, our Compensation Committee assigned each of the named executive officers an Individual Target Cash Incentive Multiple of 2.0x, the same as last year.
Then, at the end of a performance year, for each member of our senior leadership team, our Compensation Committee calculates and aggregates the weighted achievement scores for the financial performance measures and the individual non-financial objectives. When assessing the level of achievement and assigning scores for the year, our Compensation Committee takes into account the difficulty of achieving particular targets or objectives. Our Compensation Committee has discretion to assign achievement scores of up to 200% for outstanding performance and achievement scores of down to 0% for performance below target, based on its view of the level of achievement attained for each financial performance target, and for the non-financial objectives taken as a whole. With the weightings the Compensation Committee has established for each component of the calculation aggregating 100% overall, the maximum total overall weighted score achievable is 200%, and since the Individual Target Cash Incentive Multiple for each of our named executive officers is 2.0x, the maximum short-term incentive opportunity for each of our named executive officers is 4x their base salary. For the 2018 performance year, in response to the previous year's say-on-pay vote result, shareholder feedback and the advice of FW Cook, the Compensation Committee reduced Mr. Frederico's Individual Target Cash Incentive Multiple to 2.0x from 2.5x, thereby reducing his maximum short-term incentive opportunity to 4x his base salary from 5x his base salary. The Compensation Committee has maintained Mr. Frederico's Individual Target Cash Multiple at 2.0x since then, and Mr. Frederico has not received an increase in his base salary since 2017.
Our Compensation Committee may exercise negative discretion where the financial performance measure result, while above the target established by our Compensation Committee, is less than the prior year result. The Compensation Committee has exercised its negative discretion in this area most recently for the 2019 performance year. For the 2021 performance year, there was no instance
42 Assured Guaranty 2022 Proxy Statement
where the 2021 performance measure result was above the target established by our Compensation Committee but below the prior year result, so the Compensation Committee had no occasion to consider exercising its negative discretion.
Setting Financial Performance Targets
The Compensation Committee selected five of the financial performance measures in 2015 based on the unique earnings model of the financial guaranty industry. The Compensation Committee reconsiders each year whether these measures are the appropriate ones to use in light of our Company’s business. For the 2020 performance year, the Compensation Committee added a sixth financial performance measure, based on gross third-party assets, to appropriately incentivize our executives to develop and grow our asset management business. All six financial performance measures receive an equal weighting of 11.17% (so adding to 67% in total) for most of our senior leadership team. For those members of our senior leadership team with responsibility for particular aspects of our business, financial performance measures related to their areas of responsibility are weighted more heavily than the other measures. Among our named executive officers, only one has financial performance measures with unequal weighting: for Mr. Buzen, gross third party assets raised are weighted 33.5% while the other measures are weighted 6.7% (so again adding to 67% in total). The Compensation Committee believes our progress measured against the financial performance measures it established will, over the long term, result in optimal total shareholder return.
Each year the Compensation Committee sets our financial performance targets at levels it views as challenging based on the projected operating results in our annual business plan. The goals and our business plan acknowledge the unique long-term nature of our financial guaranty insurance business and that the required accounting treatment and operations of a financial guaranty insurer are distinct from other insurance product lines.
| | |
Core Operating Income per Diluted Share and Core Operating Return on Equity. Our Compensation Committee set the financial performance targets for core operating income per diluted share and core operating return on equity for the 2021 performance year materially higher than the 2020 actual results. These targets were particularly challenging when considering the unique earnings model of the financial guaranty insurance industry. When a financial guarantor writes a new financial guaranty policy, it does not earn the full amount of the premium immediately; rather, when a policy is written, the upfront premium it receives (plus the present value of future premiums) is recorded on its balance sheet as the unearned premium reserve, which we refer to as the UPR. This UPR is earned over the term of the insured obligation, often as long as 20, 30 or even 40 years. For example, only approximately 3% of the premiums we earned in 2021 related to new financial guaranty policies we wrote in 2021, and the rest was earned from our previously established UPR. Because the volume and pricing of new financial guaranty business written in a particular year has only a small impact on premium earnings for that year, most of our operating income from our core financial guaranty business may be forecast based on projections with respect to the very significant UPR that we earn as our insured portfolio amortizes. Despite the relative predictability of the contribution of our primary financial guaranty business to our core operating income per diluted share and core operating return on equity, we consider the financial performance goals we set for these measures to be challenging due to potential uncertainties in the broader market and environment. Those uncertainties include unexpected loss development, level of refunding activity, unexpected mark-to-market movements of investments in alternative investments, and unexpected changes to investment rates. In addition, variability of our share price and availability of funds for share repurchases may add to the challenges of reaching these goals. Our core operating ROE is also negatively impacted by the amount of excess capital we continue to have. Despite the strides we have made in managing our capital (see “Summary – 2021 Achievement Highlights” above), we believe we still have excess capital that we need regulatory approval to deploy, and therefore are constrained in our ability to improve our capital efficiency and our core operating ROE. |
43 Assured Guaranty 2022 Proxy Statement
| | |
Core Operating Shareholders’ Equity Per Share and Core Adjusted Book Value Per Share. Our Compensation Committee also wants to encourage our senior leadership team to build intrinsic value in our Company over time for our shareholders, so our Compensation Committee sets targets for core operating shareholders’ equity per share and core adjusted book value per share. Our Compensation Committee believes these measures best capture the long-term value we are building for our shareholders and that growth in these measures will eventually result in growth in the price of our Common Shares. Our Compensation Committee believes that core adjusted book value per share, in particular, is such an important measure of the intrinsic value we are building for our shareholders that our Compensation Committee has made this measure a component of both our short-term and long-term incentive programs. Our Compensation Committee believes that this will motivate our senior leadership team to focus on growth in this measure in both the short and long term, and that eventually growth in the price of our Common Shares will follow. |
| | |
PVP. Our annual business plan for 2021 challenged our senior leadership team to originate more financial guaranty business in 2021 than the financial guaranty business we originated in 2020. Our most direct measurement of new insurance business origination is PVP. We set our 2021 PVP target nearly 22% higher than our our 2020 actual results. |
| | |
Gross Third-Party Assets Raised. Our Compensation Committee set this target nearly 69% higher than 2020 actual results. Our Compensation Committee believes that gross third-party assets raised eliminates the “noise” of the reduction of AUM attributable to the wind-down business and is an appropriate metric against which to weigh the success of management’s efforts to grow our asset management business. |
Calculating Cash Incentive Compensation
Based on weighted achievement scores for the financial performance targets and the individual non-financial objectives for each member of the senior leadership team, the individual payouts of the cash incentive for 2021 were calculated as follows:
| | | | | | | | | | | | | | | | | | | | | | | | | | | | | | | | | | | | | | |
Annual Individual Target Cash Incentive Amount | X | Annual Achievement Score (a percentage from 0% to 200%) | | = | Annual Cash Incentive Payout |
| ( | 2021 Base Salary | X | 2021 Individual Target Cash Incentive Multiple | ) | X | ( | 2021 Financial Target Achievement Score (weighted 67%) | + | 2021 Non-Financial Objective Achievement Score (weighted 33%) | ) | = | 2021 Cash Incentive Payout |
The basic formula for determining cash incentive compensation has remained the same since our Compensation Committee developed the methodology, together with FW Cook, at the beginning of 2015, and our Company’s performance on key financial measures has improved greatly since that time. Four out of five of the financial performance measurements applicable in both periods have improved, as reflected in the table below.
| | | | | | | | | | | | | | |
FINANCIAL PERFORMANCE GOALS | 2014
Results | 2021
Results |
| Core Operating Income per Diluted Share | $2.83 | | $5.91 | |
| Core Operating Return on Equity | 8.1 | % | 7.3 | % |
| Core Operating Shareholders’ Equity per Share | $37.48 | | $88.26 | |
| Core Adjusted Book Value per Share | $53.78 | | $130.33 | |
| PVP | $172 million | | $361 million | |
| Gross Third-Party Assets Raised | NA | | $3.0 billion | |
The progress we have made on these fronts is the result of the leadership of Mr. Frederico and the efforts of our senior leadership team. As a result, our Compensation Committee retained the same general methodology and formulas for cash incentive compensation implemented in 2015 for Mr. Frederico and other members of our senior leadership team, although it has fine-tuned its methodology since then, with the addition of a new financial performance measure beginning in the 2020 performance year being the most recent change.
44 Assured Guaranty 2022 Proxy Statement
Long-Term Equity Incentives
In addition to the cash incentive compensation, our Compensation Committee awards long-term incentive compensation in the form of our Common Shares.
Like cash incentive compensation, equity incentive compensation is awarded after the end of the performance year to which such compensation relates. For the 2021 performance year, our Compensation Committee determined the amount of equity incentive compensation in February 2022.
Sixty percent of the nominal value of the award is in the form of PSUs that may be earned over a 3-year performance period based on pre-established performance targets, and are paid at the end of the 3-year performance period if particular performance targets are achieved, and the remaining forty percent is in the form of restricted share units (which we refer to as RSUs) that cliff vest at the end of a 3-year period. Details about the individual awards are set out in “CEO Performance Review” and “Other Named Executive Officer Compensation Decisions.”
For the 2022 grant with respect to the 2021 performance year, the proportion of the long-term equity incentive comprising performance-based PSUs was again 60%, with the remainder in time-based RSUs.
Performance Share Units. Each performance restricted share unit, or PSU, represents a contingent right to receive up to a certain number of our Common Shares as described below under “Incentive Plans—Assured Guaranty Ltd. 2004 Long-Term Incentive Plan”. The Compensation Committee awards PSUs with the intent of aligning executive pay with our Company’s performance.
•PSUs tied to growth in our core adjusted book value per share over a three-year period, which we refer to as ABV PSUs; and
•PSUs tied to our TSR over a three-year period relative to the TSR of the 55th percentile of the Russell Midcap Financial Services Index, which we refer to as Relative TSR PSUs.
This structure has been in place since 2019 and the Compensation Committee maintained the same structure for the February 2022 grants.
ABV PSUs
Our Compensation Committee believes that Core ABV per share is the best measure of the intrinsic value of our Common Shares, and that growth in Core ABV per share will eventually result in growth in the price of our Common Shares. Our Compensation Committee believes that this measure is so important that it has incorporated the measure into both its short-term cash incentive program and its long-term equity compensation program, so that the senior leadership team is motivated to grow Core ABV per share on both a short-term and long-term basis.
45 Assured Guaranty 2022 Proxy Statement
| | |
Each ABV PSU represents the right to receive up to two of our Common Shares at the end of a three-year performance period, which runs from January 1 of the year of the grant to December 31 three years later, depending on the growth in Core ABV per share over the three-year performance period. •The target growth rate is an aggregate of 15% over that three-year period, for which the recipient earns one Common Share for each ABV PSU. •At 80% of the target growth (or 12%), which we refer to as the threshold, the recipient earns one-half share for each ABV PSU; for growth rates below that amount, the recipient earns no Common Shares. •At 120% of the target growth (or 18%) or above, which we refer to as the maximum, the recipient earns two of our Common Shares for each ABV PSU. For Core ABV per share growth rates between the threshold and the target and between the target and the maximum, the amount of our Common Shares earned for each ABV PSU is based on straight-line interpolation. |
Our Compensation Committee set the ABV PSU target growth rate based on the projected operating results in our annual business plan and after consulting with FW Cook. In setting the ABV PSU target, our Compensation Committee did not consider significant potential or theoretical strategic activities that had not been finalized or share repurchases the funding of which require regulatory approvals that have not yet been obtained, because the conditions for success are highly contingent and outside of the control of our senior leadership team. Given the outsize positive impact on our Company of the successful achievement of at least some such endeavors, our Compensation Committee believes it is appropriate for its senior leadership team to be encouraged to pursue success in these areas through the ABV PSUs. The ABV PSU performance targets remain aligned with our long range plan and are unchanged from last year.
Relative TSR PSUs
Since our ultimate goal is to provide growing shareholder value, our Compensation Committee believes that our long-term equity incentive compensation should also be based on our TSR. However, recognizing that share prices may be influenced by a number of factors, the Compensation Committee decided that a relative measure of TSR was most appropriate.
| | |
Each Relative TSR PSU represents the right to receive up to 2.5 (for extraordinary performance at the 95th percentile) of our Common Shares at the end of a three-year performance period, which runs from January 1 of the grant year to December 31 three years later, depending on the performance of our TSR over that three-year period relative to the TSR of the Russell Midcap Financial Services Index, which we refer to as the Index. •The target Company TSR for that period is the 55th percentile of the Index, for which the recipient earns one Common Share for each Relative TSR PSU. •At the 25th percentile of the Index, which we refer to as the threshold, the recipient earns one-half share for each Relative TSR PSU; for Company TSRs below that level, the recipient earns no Common Shares. •A Company TSR at the 95th percentile of the Index, which we refer to as the maximum, or above earns the recipient 2.5 of our Common Shares for each Relative TSR PSU. For Company TSRs between the threshold and the target and between the target and the maximum, the amount of our Common Shares earned for each Relative TSR PSU is based on straight-line interpolation. The Compensation Committee adopted the following additional restrictions on the Relative TSR PSUs: •The number of Common Shares that can be earned is capped at one share per Relative TSR PSU if the Company TSR is negative, even if above the 55th percentile. •Common Shares earned pursuant to the Relative TSR PSUs remain restricted until one year after they vest. |
Our Compensation Committee selected the Russell Midcap Financial Services Index as the best available measure when it established the TSR PSUs in February 2019. Our Compensation Committee believed that aspects of our business are comparable to aspects of various financial services companies, and so determined that the best benchmark for our TSR was a broad index of somewhat similarly-sized financial services companies. The Compensation Committee made this determination after considering and rejecting a number of other options:
•Only one other financial guarantor continues to write new business, and that company is not publicly traded, so a peer group of financial guarantors is not available.
•While analysts sometimes categorize us with property and casualty insurance companies, the Compensation Committee believes that factors impacting the performance of property and casualty insurance companies are unlikely to impact our business in the same way, particularly given the unique long-term nature of our financial guaranty insurance business and the fact that the required
46 Assured Guaranty 2022 Proxy Statement
accounting treatment and operations of a financial guaranty insurer are distinct from property and casualty and other insurance product lines.
•While the current executive compensation comparison group comprises similarly-sized companies in businesses somewhat similar to our business, many of the companies in that group are mortgage finance and property and casualty insurance and reinsurance companies and our Compensation Committee does not believe that group is an appropriate benchmark for our TSR.
In late 2021, the Compensation Committee considered whether, given changes in the Russell Midcap Financial Services Index since 2019, it should change the reference index used for the TSR PSUs. It chose not to make any changes.
Restricted Share Units
| | |
| Each restricted share unit represents a right to receive one of our Common Shares at the end of a three-year vesting period as described below under “Incentive Plans—Assured Guaranty Ltd. 2004 Long-Term Incentive Plan”. |
Our Compensation Committee awards RSUs with the intent of providing members of the senior leadership team with long-term incentive compensation that increases in value as our Company achieves its strategies. Our Compensation Committee believes this incentivizes members of the senior leadership team to remain with the Company and help build shareholder value over the long term.
47 Assured Guaranty 2022 Proxy Statement
CEO PERFORMANCE REVIEW
Overview
In light of Mr. Frederico’s significant accomplishments in the 2021 performance year and the importance of his continued leadership as we work to transform ourselves into a diversified financial services company, the price performance of our shares over the last year and that we achieved five of our six financial performance targets, the Compensation Committee awarded Mr. Frederico total compensation of $11,954,988, a 6.5% increase from his total compensation for the 2020 performance year. That increase reflects our strong financial and share price performance and the achievement of non-financial strategic objectives that position us for future growth and our successful transformation into a financial services company with a dual focus on financial guaranty and asset management. The increase should also be viewed in the context of Mr. Frederico's compensation package for the 2020 performance year being 4.2% lower than the one he received for the 2019 performance year, and his 2021 compensation package being only 1.9% higher than his 2019 compensation package.
Mr. Frederico’s short-term cash incentive compensation increased by 16.0% from the prior year, largely as a function of the financial performance target scores awarded by the Compensation Committee. Our performance exceeded all but one of the six of the financial performance targets set by the Compensation Committee at the beginning of the year. As a result, the Compensation Committee awarded Mr. Frederico a weighted score on his financial performance targets of 82.1%, considerably above his score of 61.4% for 2020, when only three of the six financial performance targets were met. The Compensation Committee also awarded him a similar weighted score on his non-financial objectives for 2021, 56.1% for 2021 compared to 57.8% for 2020. Mr. Frederico’s total achievement score for 2021 was 138.2%, substantially above his score of 119.2% for 2020, but still below his total achievement score of 149.1% for 2019.
The Compensation Committee also considered the appropriate amount of long-term incentive equity compensation to award Mr. Frederico in recognition of our significant achievements despite the continued disruption of COVID-19 and the extraordinarily low interest rates of 2021. In recognition of these accomplishments and the Compensation Committee’s strong desire that Mr. Frederico continue his leadership as we execute on our multi-year strategy to transform our Company into a diversified financial services company with a dual focus on financial guaranty and asset management, the Compensation Committee granted Mr. Frederico long-term equity compensation with a target nominal value of $7,250,000, an increase of $250,000 from his grant for the 2020 performance year. Mr. Frederico’s total compensation for the 2021 performance year was composed of the following:
| | | | | | | | | | | | | | | | | | | | | | | | | | |
| 2021
Performance Year
Compensation | 2020 Performance Year Compensation | 2019
Performance Year Compensation | Change
from
2020 to 2021 |
Fixed Compensation—Base Salary (1) | $1,250,000 | | $1,250,000 | | $1,250,000 | | — | % |
| Incentive Compensation | | | | | | | | |
| Cash Incentive Compensation | $3,454,988 | | $2,979,625 | | $3,727,000 | | 16.0 | % |
| Long-Term Performance-Based Equity | $4,350,000 | (2) | $4,200,000 | (2) | $4,050,000 | (2) | 3.6 | % |
| Long-Term Time-Based Equity | $2,900,000 | (2) | $2,800,000 | (2) | $2,700,000 | (2) | 3.6 | % |
| Total Direct Compensation | $11,954,988 | | $11,229,625 | | $11,727,000 | | 6.5 | % |
(1) Mr. Frederico’s base salary for each of the 2021, 2020 and 2019 performance years was established at the beginning of such performance year, in February. Accordingly, Mr. Frederico’s 2021 base salary was established in February 2021.
(2) Represents the Compensation Committee’s target nominal value for the relevant performance year. The number of units granted is calculated by dividing such value by the average stock price over the 40 consecutive trading days ending on the date of grant.
]
48 Assured Guaranty 2022 Proxy Statement
The compensation package presented in the table above is different from the SEC-required disclosure in the Summary Compensation Table below and is not a substitute for the information in that table. Rather, it is intended to show how the Compensation Committee linked Mr. Frederico’s compensation and its components to our performance results and his achievements for the prior year. The base salary is paid during the performance year, while all of the components of the incentive compensation is based on achievements during the performance year and so is awarded in the first quarter of the following year.
Base Salary
Each February the Compensation Committee determines Mr. Frederico's base salary for that performance year. Consistent with the Compensation Committee's pay-for-performance philosophy, it has since 2017 chosen to maintain Mr. Frederico’s base salary at $1,250,000 and to use incentive compensation to reward him for his performance, experience and contributions and to motivate him to continue his leadership.
Cash Incentive
To determine Mr. Frederico’s cash incentive, as discussed above, the Compensation Committee used a formula that involved aggregating the weighted achievement scores for certain financial performance targets and individual non-financial objectives, and multiplying the result by Mr. Frederico’s Individual Target Cash Incentive Amount. Please refer to the diagram and discussion found above under “Executive Compensation Program Structure and Process—Components of Our Executive Compensation Program—Cash Incentive Compensation.”
Setting Mr. Frederico’s 2021 Financial Performance Targets
In February 2021, the Compensation Committee established targets for six financial performance measurements for Mr. Frederico (and for each other member of our senior leadership team) for the 2021 performance year. The financial performance targets were based on the business plan that the Board of Directors reviewed and approved in November 2020, and were designed to measure our progress in creating value for our shareholders. We include above under “Executive Compensation Program Structure and Process—Components of Our Executive Compensation Program” a detailed description of the financial performance measurements, and why the Compensation Committee considers them to be important in assessing our Company and the performance of each member of our senior leadership team. Five of the six targets are based on non-GAAP financial measures.
The Compensation Committee set all of the 2021 targets for the financial performance measurements above the 2020 actual results, some substantially, and viewed all of the 2021 targets as challenging in light of then current market conditions and the nature of our business model.
Mr. Frederico’s 2021 Financial Performance Target Scores
In 2021, we exceeded all but one of the six 2021 targets for the financial performance measures.
•Core operating income per share of $5.91 was nearly 63% above our target and 90% above our actual 2020 results.
•Core operating ROE was nearly 60% above our target and more than 65% above our actual 2020 results.
•Core operating shareholders’ equity per share reached its highest level in our history, increasing nearly 13% from year-end 2020 and exceeding our goal by nearly 7%.
•Core adjusted book value, which we refer to as Core ABV, per share increased by more than 13%, exceeded our goal by more than 6% and reached its highest level in our history.
•The $361 million of PVP we produced was nearly 25% below our goal and also 7% below our achievement in 2020. Some of this shortfall can be attributed to the interest rate environment — the average 30-year AAA Municipal Market Data (MMD) rate (a measure of interest rates in our largest financial guaranty insurance market, U.S. public finance) for 2021 was 1.54%, below the 1.71% average for the prior year and a new historical low.
•Our gross third-party gross assets raised were nearly 85% above our actual 2020 results and nearly 9% above our goal.
We achieved these results despite a persistently challenging business environment.
•Financial services is a “people business”, and the travel and gathering restrictions tied to the COVID-19 pandemic were substantial obstacles to building new relationships.
•Over the last several years, municipal bond yields have been at historically low levels, making our financial guaranty product less attractive to issuers and generally lowering the premium rate we may charge. As noted above, the average 30-year AAA MMD rate for 2021 was 1.54%, below the 1.71% average for the prior year and a new historical low.
•The difference, or credit spread, between the 30-year A-rated general obligation relative to the 30-year AAA MMD averaged 33 bps in 2021, down from 42 bps in 2020. BBB credit spreads measured on the same basis averaged at 70 bps in 2021, significantly
49 Assured Guaranty 2022 Proxy Statement
tighter than the 121 bps average in 2020. Both the A and BBB credit spreads are at their narrowest levels in over a decade. Tighter credit spreads generally lower the premium rates the Company may charge.
•We continued to face competition in an already tight market from a second financial guaranty insurer that focuses on a smaller portion of the market than we do and provides price competition in those markets where we overlap.
•Despite the strides we have made in managing our capital, we believe we still have excess capital that we need regulatory approval to deploy, and therefore are constrained in our ability to improve our capital efficiency and core operating ROE.
The Compensation Committee assigned Mr. Frederico achievement scores for his achievements against each individual financial performance target, and then weighted his financial performance measurement scores in accordance with the cash incentive formula, which resulted in a weighted financial performance goal score of 82.1%:
2021 CEO Financial Performance Scorecard
| | | | | | | | | | | | | | | | | |
| 2021 Targets | 2021 Results | Weighting | 2021
Achievement
Score
(0%-200%) | Weighted
Achievement
Score |
| Financial Performance Measurements* | | | | | |
| Core operating income per diluted share | $3.62 | $5.91 | 11.17% | 165% | 18.4% |
| Core operating ROE | 4.6% | 7.3% | 11.17% | 170% | 19.0% |
| Core operating shareholders’ equity per share | $82.90 | $88.26 | 11.17% | 110% | 12.3% |
| Core ABV per share | $122.60 | $130.33 | 11.17% | 110% | 12.3% |
| PVP | $475 million | $361 million | 11.17% | 75% | 8.4% |
| Gross third-party assets raised | $2.7 billion | $3.0 billion | 11.17% | 105% | 11.7% |
| Total Financial Performance Measurement Achievement Score | | | 67.0% | | 82.1% |
* Five of the six financial performance measurements are based on non-GAAP financial measures, which are described on page __ under “Non-GAAP Financial Measures.”
50 Assured Guaranty 2022 Proxy Statement
Mr. Frederico’s Non-Financial Objectives
The Compensation Committee also evaluated Mr. Frederico’s 2021 achievements against his 2021 non-financial objectives. Highlights of those achievements include completing two plan support agreements in 2021, covering 74% of the Puerto Rico debt outstanding on December 31, 2021, and enabling a benefit against our expected losses related to Puerto Rico that was the primary driver of the $204 million economic benefit against our expected losses in the public finance sector; improved expected recoveries and performance of our insured RMBS portfolio; and successful management of capital by issuing new public debt and retiring higher interest debt, and by returning $562 million to shareholders while building our core businesses. This was accomplished while successfully navigating COVID-19 restrictions and taking important steps in environmental and social responsibility areas.
| | | | | |
| Non-Financial Objectives | 2021 Results |
Insurance Growth—Articulate clear strategy and lead effective implementation of business plan to grow financial guaranty and related business globally •Expand U.S. public finance financial guaranty business •Expand global infrastructure financial guaranty business
•Expand global structured finance financial guaranty business
•Attempt to purchase bond insurance portfolios if they become available for purchase
•Maintain strong financial strength ratings at insurance companies to facilitate articulated business strategies and periodically assess the financial strength ratings of each insurance company to determine whether to request that a rating agency add or drop a rating from that company
| Underwrote a total of $361 million of PVP despite continued low interest rates and credit spreads, as follows: •$235 million of U.S. Public Finance PVP •$79 million of International PVP •$47 million of Global Structured Finance PVP
U.S. Public Finance: •As a result of increased institutional demand for our insurance, in 2021, we insured $22.6 billion of new issue par on 1,076 individual transactions (including the Citi Field and Miami Seaport transactions, where we insured $609 million and $800 million of gross par, respectively) •Industry insured penetration rose to 8.2% of municipal par insured for 2021 in the primary market, the highest in a dozen years •The $22.6 billion that we insured in the primary market in 2021 was 15% higher than 2020, and 62% higher than 2019 (the last year not affected by the pandemic), and our highest insured par in a decade
International Public Finance: •Wrote $79 million of PVP, representing the third largest amount in over a decade, including the guarantee of a student housing transaction with University of Essex ($156 million par) •Sustained trend started in the fourth quarter of 2015 of writing new business in each quarter; opportunities continue to support our targets Global Structured Finance:
•Wrote $47 million of PVP, representing the second largest amount in over a decade (excluding a portfolio reinsurance transaction)
• |
51 Assured Guaranty 2022 Proxy Statement
| | | | | |
| Non-Financial Objectives | 2021 Results |
Insurance Loss Mitigation and Avoidance—Proactively manage financial guaranty portfolio to identify and avoid losses when stress develops and minimize losses when losses cannot be avoided •Use all available levers to creatively resolve Puerto Rico credits while minimizing losses to the Company | •Completed two plan support agreements with the Federal Oversight Management Board for Puerto Rico and other important stakeholders in 2021, covering 74% of the insured Puerto Rico debt outstanding on December 31, 2021 •Significantly improved expected recoveries and performance of RMBS portfolio |
Asset Management and Alternative Investments—Lead effective implementation of asset management and alternative investment strategies •Grow assets under management (AUM) organically and/or through acquisitions •Improve yield on investment portfolio by investing a portion of excess capital in alternative investments | •Raised $3.0 billion of inflows of third-party AUM, and now manage $16.1 billion in third-party AUM •Reduced AUM of wind down funds by 64% from $1,623 million to $582 million
•Increased CLO fee-earning AUM and the recovery of previously deferred CLO fees, resulting in a 109% increase in CLO fees
•Committed $209 million in additional insurance company capital into AssuredIM funds, bringing total committed capital in AssuredIM funds to $702 million
•Capital invested in AssuredIM Funds generated $80 million in pretax equity in earnings, representing a blended return of 20.8%
•Other alternative investments (not AssuredIM Funds) contributed $64 million in pretax equity in earnings |
Capital Management—Articulate clear strategy to maintain optimal capital structure, considering internal risk measures and rating agency and regulatory requirements •Accumulate capital outside of insurance companies to support asset management and other strategies •Return excess capital to shareholders | •Returned $562 million to our shareholders — $496 million by repurchasing 10.5 million of our Common Shares and $66 million through dividends •Issued $500 million of 10-year Senior Notes at an attractive rate of 3.15% in May and issued $400 million of 30-year Senior Notes at an attractive rate of 3.6% in August, benefiting the Company by (i) reducing the average coupon on $600 million of our debt from 5.89% to 3.35%, resulting in a $5.2 million annual debt service savings until the next debt maturity date; (ii) reducing the amount of debt coming due in 2024; and (iii) using some of the debt proceeds for share repurchases, all without significantly affecting leverage or interest coverage ratios |
52 Assured Guaranty 2022 Proxy Statement
| | | | | |
| Non-Financial Objectives | 2021 Results |
| Regulatory—Maintain optimal corporate and regulatory structure and good standing to pursue the articulated business strategies | •Completed merger of Municipal Assurance Corp. into Assured Guaranty Municipal Corp. on April 1, 2021, which simplified corporate structure and increased dividend capacity •Obtained approval for $250 million of insurance company assets to be drawn over a two-year period into AssuredIM Funds •Obtained approval for new Assured Guaranty Municipal and Assured Guaranty Corp. quota share reinsurance agreement •Obtained approval for arrangements supporting renewed European structured finance underwriting |
Risk Management—Ensure that the Company has comprehensive, best-practice risk management with respect to all of its activities •Insure credits of good quality consistent with underwriting guidelines and consistent with risk appetite statement
•Articulate and execute thorough enterprise risk management program | •No unanticipated risk issues •Enhanced underwriting procedures to identify insurable credits with ample financial strength to withstand crisis caused by the COVID-19 pandemic; all new business within risk limits and risk appetite statement
•Updated stress analysis of the pandemic’s impact on the insured portfolio; liquidity claims for 2021 remained nominal •Participated in periodic conference calls with regulators to focus on (i) Assured Guaranty’s processes for monitoring and reevaluating its exposure in light of changing economic conditions, (ii) any changes in the ability of obligors, especially municipal obligors, to make scheduled debt payments, and (iii) Assured Guaranty’s liquidity and solvency position under adverse stress scenario
•Successful testing of Business Continuity Plan in 2021, as employees have been able to effectively work remotely since mid-March of 2020 |
Operations—Establish an environment of excellence in all areas of operations, including investment management, accounting and financial reporting, and legal and compliance, and provide a secure information technology environment
| •All financial statements and regulatory reports completed successfully and filed on time •Transitioned IT team to our new CTO while pivoting to a hybrid work schedule and layering pandemic response atop existing IT mandates •Successful Annual General Meeting, with shareholders supporting all proposals, including over 92% support of compensation paid to named executive officers
•Extensive support and collaboration with IT Security to identify, analyze and address issues related to cybersecurity events
•Successfully passed IT penetration testing
•Successfully avoided ransomware and security attacks
•Successful integration of AssuredIM IT systems, compliance regime, and office space
•Successfully automated legacy accounting and investment accounting and reporting systems |
53 Assured Guaranty 2022 Proxy Statement
| | | | | |
| Non-Financial Objectives | 2021 Results |
Human Capital Management – Attract and retain talented employees, invest in the development of our people and strive for a diverse work force and an inclusive culture | •Expanded recruiting process in an effort to reach a more diverse slate of candidates
•Created and funded a strategic initiative to enhance educational opportunities for underserved populations in the New York City area as just one part of our philanthropic activities in support of our communities
•Established Employee Resource Groups for Black / African American employees, women, and working parents
•Issued statements (i) condemning religious hate crimes and discrimination, and (ii) opposing violence and discrimination against Asian American and Pacific Islander (AAPI) communities, and made contributions to various organizations that work to promote a more equitable society |
| Environmental and Social Responsibility – Pursue clear strategies for assessing and mitigating the long-term impact of climate change on the Company’s businesses, and pursue opportunities to be a good corporate citizen | •Measured and disclosed greenhouse gas (GhG) emissions; GhG methodology and results are independently verified •Developed new underwriting criteria to address climate change risk
•Created AssuredIM and Assured Healthcare Partners Environmental, Social and Governance (ESG) statements; conducted annual ESG review of investment portfolio
•Developing an analysis of risk aggregation of the insured portfolio along the coastline for rising sea levels and hurricane 5 risks
•Created employee-led Diversity and Inclusion (D+I) Committee
•Held bias awareness training sessions for entire firm and continued work with D+I committee to expand employee diversity and provide for an inclusive corporate culture •Held D+I hosted events throughout the year |
Based on Mr. Frederico’s 2021 achievements against his 2021 non-financial objectives, the Compensation Committee awarded him an achievement score of 170% against those objectives. Applying that score to the cash incentive formula resulted in a weighted non-financial objective score of 56.1%.
The Compensation Committee then added that weighted non-financial objective score of 56.1% to the weighted financial performance target score of 82.1% achieved by Mr. Frederico as described earlier, to derive a total achievement score of 138.2% in accordance with the cash incentive formula, as follows:
Summary 2021 CEO Performance Scorecard
| | | | | | | | | | | |
| Weighting | 2021
Achievement
Score
(0%-200%) | Weighted Achievement
Score |
Total Financial Performance Measurement Achievement Score (Summarized on page 50 above.) | 67% | 122.5% | 82.1% |
| Non-Financial Objective Score | 33% | 170% | 56.1% |
| Achievement Score | | | 138.2% |
In reviewing Mr. Frederico’s 2021 performance scorecard as a whole, the Compensation Committee determined that he had very strong performance. In particular, the Compensation Committee found that Mr. Frederico should be recognized for us exceeding all but one of our six financial performance targets set by the Compensation Committee for 2021, some of them by a very significant amount. The
54 Assured Guaranty 2022 Proxy Statement
Compensation Committee also deemed it to be important to recognize that our share price of $50.20 at December 31, 2021, had increased 59.4% from our share price of $31.49 on December 31, 2020. The Compensation Committee also considered the scorecard as a whole in light of the 20.1% reduction in Mr. Frederico's cash incentive compensation for the 2020 performance year, when we met only three of our six financial performance targets for 2020, versus the 2019 performance year. Given this very significant reduction for the prior performance year and the substantial outperformance of most of the six financial performance targets for the 2021 performance year, the Compensation Committee concluded that it was appropriate that Mr. Frederico’s short-term cash incentive payment increase appreciably.
Based on Mr. Frederico’s achievements, the Compensation Committee awarded him a total achievement score of 138.2% for the 2021 performance year, 15.9% above his achievement score of 119.2% for the 2020 performance year but still below the 149.1% achieved for the 2019 performance year. Applying this achievement score to his Individual Target Cash Incentive Amount resulted in a cash incentive award of $3,454,988. This was $457,363 (or 16%) more than the $2,979,625 awarded to Mr. Frederico for the 2020 performance year, but still $272,012 (or 7.3%) less than the $3,727,000 awarded to him for the 2019 performance year.
Equity Compensation
The Compensation Committee awarded all of Mr. Frederico’s long-term incentive compensation in the form of PSUs and RSUs. The $7,250,000 target nominal amount of long-term equity constituted less than a 4% increase over the target nominal amount for the prior year. The Compensation Committee wished to provide Mr. Frederico with a strong incentive to continue his valued leadership of our Company and to generate long-term, sustained growth that will enhance shareholder value as we continue our multi-year effort to establish AssuredIM in the asset management business while growing our insurance business, and so become the diversified dual-focused financial services company that we envision.
The following table sets forth the target nominal amount of long-term incentive compensation the Compensation Committee awarded Mr. Frederico on February 23, 2022, the grant date. The Compensation Committee determined the number of PSUs and RSUs to award Mr. Frederico by converting the target nominal amount of the award using $54.30, which was the average price of our Common Shares over the 40 consecutive trading days ending on February 23, 2022.
When we prepare the Summary Compensation Table, we report the value of the grants using U.S. generally accepted accounting principles (which we refer to as U.S. GAAP), in accordance with the SEC’s rules.
•Under U.S. GAAP, the value of an ABV PSU as of February 23, 2022 was determined to be $56.69. This value is based on the closing price of our Common Shares on that date, which U.S. GAAP allows as a practical expedient to value grants with complicated features, such as in this case the estimated growth rate of the Company’s Core ABV per share.
•Under U.S. GAAP, the value of a Relative TSR PSU on February 23, 2022 was $83.97. This value was computed using a Monte-Carlo simulation model taking into account the historical relationship of our TSR and the TSR of the Index, including for the period from the beginning of the Relative TSR PSU performance period to February 23, 2022, the grant date. We engaged Aon to provide this computation for us.
•Under U.S. GAAP, the value of an RSU was $56.69, based our Common Share closing price on February 23, 2022.
Because the price of our Common Shares can be volatile, our Compensation Committee since 2012 has determined the number of shares to be granted to members of our senior leadership team by dividing the target nominal value of the equity it wished to award by the average price of our Common Shares over the 40 consecutive trading days ending on the grant date. As described above, U.S. GAAP valuations are based on the price of our Common Shares on the grant date.So, when the price of our Common Shares is higher on the grant date than the average price over the 40 previous consecutive trading days, the U.S. GAAP value will exceed our Compensation Committee’s target nominal value, as was the case this year, as well as last year.Similarly, when the price of our Common Shares is lower on the grant date than the average price over the 40 consecutive trading days ending on the grant date, the U.S. GAAP value will be less than our Compensation Committee’s target nominal value, as was the case in 2020.Our adoption of a Relative TSR PSU has exacerbated this effect, since price movements of our Common Shares from the beginning of the measurement period (the beginning of the year) to the grant date compared to the price movements of the Index have a material impact on the U.S. GAAP value of the TSR PSUs.Last year, the Compensation Committee’s target nominal value of the total long-term equity incentive grants was $7,000,000,while the U.S. GAAP value was $9,239,643, or nearly 32% more.This year, the movement of the price of our Common Shares was less dramatic during the relevant period than last year, so the difference between the Compensation Committee’s target nominal value and the U.S. GAAP value was not as large as last year. The Compensation Committee believes solely using the average over 40 consecutive trading days approach to sizing its long-term equity incentive grants is the fairest approach to use in light of the volatility of the price of our Common Shares.
55 Assured Guaranty 2022 Proxy Statement
The aggregate value of Mr. Frederico’s February 2022 long-term equity incentive grants under U.S. GAAP is set forth below.
| | | | | | | | | | | |
| Compensation Committee Target Nominal Value | Equity Granted (Shares) | U.S. GAAP Value |
| ABV PSUs | $2,175,000 | 40,055 | $2,270,718 |
| Relative TSR PSUs | $2,175,000 | 40,055 | $3,363,418 |
| RSUs | $2,900,000 | 53,407 | $3,027,643 |
| TOTAL | $7,250,000 | 133,517 | $8,661,779 |
Perquisites
The Compensation Committee reviewed the executive perquisites provided to Mr. Frederico in 2021. The Compensation Committee noted the cost and personal inconvenience entailed in leading a Bermuda-based company with substantial operations in the U.S., U.K. and Europe, and evaluated the value of perquisites provided to Mr. Frederico against the values of perquisites provided to the chief executive officers of the six other Bermuda-based companies in our current executive compensation comparison group. Based on information in the 2021 proxy statements of those six companies, in 2020 Mr. Frederico received the lowest value of perquisites of the chief executive officers of Bermuda-based companies in our current executive compensation comparison group, and in 2021 he received less value than he received in 2020. On this basis, the Compensation Committee concluded that the value of perquisites provided to Mr. Frederico under our existing policies is reasonable.
OTHER NAMED EXECUTIVE OFFICER COMPENSATION DECISIONS
Non-Financial Objectives and Achievements of the Other Named Executive Officers
The Compensation Committee made compensation awards to the other named executive officers for the 2021 performance year based on its assessment of their achievements and Mr. Frederico’s review of their performance, as well as Mr. Frederico’s compensation recommendations. The other named executive officers’ achievements were evaluated based on their contributions to our achievement of our financial measurement targets, their contributions to the achievement of Mr. Frederico’s non-financial objectives, and their own achievements of the individual non-financial objectives Mr. Frederico had assigned to them, as described below.
Robert A. Bailenson, Chief Financial Officer
Mr. Bailenson was responsible in the 2021 performance year for meeting all internal and external financial requirements, managing our capital efficiently, meeting with investors, and participating on earnings calls. Mr. Bailenson has involved himself in all aspects of our business and leads the financial team in addressing market and regulatory changes. More specifically, Mr. Bailenson:
•Successfully refinanced our $430 million of 100-year debt with interest rates ranging from 6 7/8% to 5.6%, plus $170 million of the $500 million of 5% senior notes we had due in 2024, with an issuance in May of $500 million of 3.15% senior notes due 2031 and an issuance in August of $400 million of 3.6% senior notes due 2051; also used some of the debt-issuance proceeds for general corporate purposes, primarily to fund our share repurchase program;
•Successfully oversaw the automation of legacy accounting and investment accounting and reporting systems;
•Held various meetings with rating agencies, which resulted in an upgrade of Assured Guaranty Corp., which we refer to as AGC, by Kroll Bond Rating Agency, Inc. to AA+ from AA;
•Worked with Mr. Buzen to increase the efficiency and efficacy of our investment activities;
•Actively participated in loss mitigation and settlement activities relating to Puerto Rico, as well as ensuring that the accounting reporting was appropriate;
•Was responsible for the timely and accurate filing of all financial statements and tax returns; and
•Acts as executive sponsor for our Working Parent Employee Resource Group.
Ling Chow, General Counsel
Ms. Chow is an effective leader of legal resources for our Company. Her work managing corporate governance and other issues before our Board was exemplary. Under Ms. Chow’s direction, we were able to navigate the complex compliance and regulatory environments of both the insurance and asset management segments of our business to accomplish our corporate objectives. More specifically, Ms. Chow:
•Supervised the Legal department’s contribution to our efforts to mitigate losses on our insured Puerto Rico exposure, including negotiating support agreements, pursuing legal proceedings, and developing a short-term financing structure to facilitate anticipated claim payments;
56 Assured Guaranty 2022 Proxy Statement
•Supervised the legal analysis and support for all our underwriting activity, including developing criteria to underwrite several new Structured Finance asset classes;
•Managed litigation matters involving our financial guaranty business as well as our asset management business;
•Provided legal advice on the various initiatives of our employee-led D+I Committee; and
•Headed a Legal and HR team responsible for keeping abreast of COVID-19 developments and regulations in each of our offices around the world, in an effort to maintain the health and safety of all staff.
Russell B. Brewer II, Chief Surveillance Officer
Mr. Brewer was responsible in the 2021 performance year for ensuring that all of our insured exposures are reviewed annually and assigned appropriate internal ratings, for managing loss mitigation strategies for our troubled credits, and for overseeing our IT department. Mr. Brewer has been a major contributor to the successful operations of our company and has been a thought leader in our relationships with our rating agencies. (Effective December 31, 2021, Mr. Brewer resigned as Chief Surveillance Officer and became, effective January 1, 2022, Senior Advisor to Chief Executive Officer.) More specifically, Mr. Brewer:
•Led the surveillance process for our $236 billion net par insured portfolio and the timely review and updating of internal ratings for our insured portfolio, helping to identify and intervene in deteriorating situations to avoid or mitigate losses;
•Actively participated in periodic rating agency meetings including annual rating reviews and discussions to describe the risks faced from COVID-19 and strategies to address such risks while working in a full remote environment;
•Oversaw and participated in many of our risk mitigation activities, including making major contributions to our effort in Puerto Rico;
•Oversaw the automation of our legacy accounting and investment accounting and reporting systems;
•Oversaw the successful transition of the IT team to our new Chief Technology Officer while pivoting to a hybrid work schedule and layering pandemic response atop existing IT mandates; and
•Oversaw the effective defense of our systems from cyberattacks and our compliance with evolving cybersecurity regulations.
David A. Buzen, Chief Investment Officer and Head of Asset Management
Mr. Buzen was responsible in the 2021 performance year for guiding investment decisions for our investment portfolio and building our asset management business. More specifically, Mr. Buzen:
•Oversaw the raising of $3.0 billion in gross third-party assets;
•Successfully increased CLO fee-earning AUM and the recovery of previously deferred CLO fees, resulting in a 109% increase in CLO fees;
•Used the knowledge base and experience of AssuredIM to expand the categories and types of investments included in our investment portfolio — capital invested in AssuredIM Funds generated $80 million in pretax equity in earnings in 2021, nearly double the $42 million generated in 2020, and representing a blended return of 20.8% in 2021; and
•Convened a team of Finance, Investment, Workout and Legal personnel to develop a funding plan for anticipated Puerto Rico claim payments.
57 Assured Guaranty 2022 Proxy Statement
Compensation Decisions for the Other Named Executive Officers
The 2021 base salaries of our other named executive officers were set by the Compensation Committee in February 2021. Consistent with the Compensation Committee's pay-for-performance philosophy, it chose to set Mr. Bailenson's 2021 salary at the same level as 2020, and Mr. Buzen's 2021 salary at the same level as it had been set in August 2020 when he became Chief Investment Officer and Head of Asset Management, and to use incentive compensation to reward each of them for their performance, experience and contributions, and to motivate them to continue their leadership of their respective functions. In light of Ms. Chow’s achievements for the 2020 performance year and the complexity of the issues handled by the legal department, the Compensation Committee supported Mr. Frederico's recommendation to increase her salary to $600,000 from $550,000 for the 2021 performance year. In recognition of the steadiness with which Mr. Brewer manages both the surveillance and the information technology departments, the efforts of the surveillance department in analyzing the potential impact of COVID-19 on the insured portfolio, and Mr. Brewer’s recruitment of a new chief technology officer during the year, the Compensation Committee also supported Mr. Frederico's recommendation to increase Mr. Brewer's salary to $550,000 from $525,000 for the 2021 performance year. In February 2022 the Compensation Committee decided to maintain the 2022 salaries of all of the other named executive officers at their 2021 levels.
In the case of the other named executive officers, for the 2021 performance year the Compensation Committee calculated and aggregated the weighted achievement scores for the financial performance targets (which were the same as Mr. Frederico’s except in the case of Mr. Buzen, whose financial performance measures were more heavily weighted to gross third-party assets raised) and their non-financial objectives (which were a combination of their contribution to Mr. Frederico’s non-financial objectives and their achievement of their own individual non-financial objectives), taking into account the level of difficulty of achieving particular targets or objectives. Based on their achievements, after applying the formula, the Compensation Committee awarded them the cash incentives calculated as shown in the table below.
| | | | | | | | | | | | | | | | | | | | | | | | | | | | | | | | | | | | | | | | | |
| ( | 2021 Base Salary | X | 2021 Individual Target Cash Incentive Multiple | ) | X | ( | Financial Performance Measurement Achievement Score (weighted 67%) | + | Individual Non- Financial Objective Achievement Score (weighted 33%) | ) |
= | 2021 Cash Incentive Payout |
| Robert A. Bailenson | | $800,000 | | 2.00x | | | | 82.1% | | 46.2% | | | $2,052,792 |
| David A. Buzen | | $800,000 | | 2.00x | | | | 73.1% | | 33.0% | | | $1,696,480 |
| Ling Chow | | $600,000 | | 2.00x | | | | 82.1% | | 42.9% | | | $1,499,994 |
| Russell B. Brewer II | | $550,000 | | 2.00x | | | | 82.1% | | 42.9% | | | $1,374,995 |
The Compensation Committee awarded all of the other named executive officers long-term incentive compensation in the form of PSUs and RSUs with the same terms and in the same proportion as the PSUs and RSUs awarded to Mr. Frederico. The target nominal amount of long-term equity reflected the Compensation Committee’s desire that each of the other named executive officers have a strong incentive to help generate long-term, sustained growth for our Company. The amounts of PSUs and RSUs awarded to each other named executive officer vary by individual and are based on their respective positions and levels of responsibility, historic compensation levels and FW Cook’s advice about the compensation practices of companies in our comparison group.
The Compensation Committee considered FW Cook’s analysis of the compensation paid to named executive officers in the 21-company executive compensation comparison group constituted by FW Cook in 2021, which we refer to here as our current executive compensation comparison group, when evaluating the compensation of our named executive officers. (Our current executive compensation comparison group, and how it changed from our 2020 executive compensation comparison group, is described under “Compensation Governance—Executive Compensation Comparison Group” below). According to FW Cook, for the 2020 performance year, which is the most recent data available, the target total direct compensation for our named executive officers (excluding Mr. Frederico) ranked at the 63rd percentile on average, ranging from below median to above the 75th percentile, of amounts for the named executive officers of our current executive compensation comparison group, reflecting the experience, leadership, specialized skill sets and sustained performance of our senior leadership team. Actual total direct compensation for all our named executive officers as a group (excluding Mr. Frederico) paid for the 2020 performance year ranked at the 64th percentile of our current executive compensation comparison group, reflecting our non-equity incentive payouts for 2020 performance, which were aligned with our 2020 performance relative to our key business goals and strategies, as well as our strong financial performance for that period. For the 2021 performance year, our one-year TSR was 62.35%, the highest of our current executive compensation comparison group, and our three-year TSR at the end of 2021 was in the 43rd percentile of our current executive compensation comparison group. Our long-term incentive equity awards generally remain unchanged and continue to align with our current executive compensation comparison group.
58 Assured Guaranty 2022 Proxy Statement
In summary, the Compensation Committee approved the following compensation decisions for the named executive officers other than Mr. Frederico for the 2021 performance year:
| | | | | | | | | | | | | | |
| Robert A.
Bailenson | David A.
Buzen | Ling Chow | Russell B.
Brewer II |
Fixed Compensation—Base Salary(1) | $ 800,000 | $ 800,000 | $ 600,000 | $ 550,000 |
| Incentive Compensation | | | | |
| Cash Incentive Compensation | $2,052,792 | $1,696,480 | $1,499,994 | $1,374,995 |
Long-Term Equity Incentive Target Values(2) | $1,575,000 | $770,000 | $1,200,000 | $1,250,000 |
| Total Direct Compensation | $4,427,792 | $3,266,480 | $3,299,994 | $3,174,995 |
(1) These base salaries were set by the Compensation Committee in February 2021.
(2) Except in the case of Mr. Brewer, the long-term equity incentive awards were allocated similarly to Mr. Frederico’s, and comprised 30% ABV PSUs, 30% Relative TSR PSUs and 40% RSUs. Mr. Brewer's long-term equity incentive award was paid as restricted share units with one-third vesting on the first, second and third anniversaries of the grant. The U.S. GAAP values of the awards are: Mr. Bailenson, $1,881,704; Mr. Buzen, $919,944; Ms. Chow, $1,433,680; and Mr. Brewer, $1,250,000.
SEPARATION AGREEMENT
As previously disclosed in our Current Report on Form 8-K filed on January 4, 2022, Mr. Brewer resigned as Chief Surveillance Officer and as an executive officer of AGL, effective December 31, 2021, in accordance with a separation and release agreement, which we refer to as the Separation Agreement, between Mr. Brewer and us. We entered into the Separation Agreement with Mr. Brewer in recognition of his successful years at our Company and to encourage him to work through December 31, 2022, in order to facilitate the transition of his duties to other persons in our company.
Pursuant to the Separation Agreement, Mr. Brewer remains employed by us in a non-executive officer position, serving as Senior Advisor to the Chief Executive Officer of the Company, for a transition period, which we refer to as the Transition Period, from January 1, 2022 to December 31, 2022, which we refer to as the Retirement Date.
The Separation Agreement provides for the following payments to Mr. Brewer:
•A non-equity incentive payment for the 2021 performance year in March 2022 as determined by the Compensation Committee based on his contributions to our achievement of our financial measurement targets, his contributions to the achievement of Mr. Frederico’s non-financial objectives, and his own achievement of the individual non-financial objectives Mr. Frederico had assigned to him, which payment was $1,374,995.
•An equity incentive payment for the 2021 performance year in March 2022 as determined by the Compensation Committee, which was $1,250,000. The Separation Agreement provided that, rather than being paid as RSUs and PSUs, Mr. Brewer's long-term equity incentive for the 2021 performance year would be paid as restricted share units with one-third vesting on each of the first, second and third anniversaries of the grant.
•If Mr. Brewer remains employed through the Retirement Date, he will continue to receive his base salary of $550,000 per annum through the Retirement Date.
•If Mr. Brewer remains employed through the Retirement Date, in recognition of his work through the Transition Period he will be granted a non-equity incentive payment with a target amount equal to one-quarter of his March 2022 payment for the 2021 performance year, or $343,749.
Pursuant to the Separation Agreement, if Mr. Brewer remains employed through the Retirement Date, any unvested equity awards that he holds on the Retirement Date will vest in accordance with the terms that the applicable award agreement provides upon retirement. However, any previously granted equity awards that include Company performance-based vesting conditions remain subject to satisfaction of such applicable performance conditions following the Retirement Date. In addition, Mr. Brewer will be reimbursed for expenses incurred in the preparation of his tax returns through the 2022 tax year.
The Separation Agreement contains covenants by Mr. Brewer relating to protection of our confidential information, cooperation, non-competition, non-solicitation and non-disparagement and other standard provisions. Mr. Brewer executed a release of claims as part of the Separation Agreement and the Separation Agreement provides that Mr. Brewer will execute another release of claims after his retirement such that the second release becomes effective within 60 days following his retirement. Payments pursuant to the Separation Agreement are subject to forfeiture and/or clawback in the event of violation of these covenants.
59 Assured Guaranty 2022 Proxy Statement
2021 EXECUTIVE COMPENSATION CONCLUSION
Our Compensation Committee wished to recognize the considerable accomplishments of Mr. Frederico and our other named executive officers in leading our Company through another challenging year brought on by the continued combination of the COVID-19 pandemic and historically low interest rates. As such, our Compensation Committee determined that it was appropriate that Mr. Frederico and the other named executive officers experience an increase in their short term cash incentive payments consistent with exceeding all but one of the six financial performance targets set by our Compensation Committee last year, particularly in a year in which the price of our shares increased as much as it did. The Compensation Committee also believes the contributions of each of these individuals is critical to successfully accomplish our multi-year transformation into a diversified financial services company with a dual focus on financial guaranty insurance and asset management. The Compensation Committee addressed these objectives by granting these individuals long-term equity awards that the Compensation Committee believes will provide appropriate motivation for them to see the transformation through.
The Compensation Committee believes that our executive compensation program rewards performance and motivates each member of our senior leadership team to increase shareholder value, and that it is therefore appropriate and in the best interests of our Company and our shareholders. Our strategy requires exceptionally qualified and experienced management in senior financial guaranty executive, finance and legal positions, including personnel with skills and experience in reinsurance, acquisitions and corporate integration as well as asset management, and the ability to deal with adverse market conditions and take advantage of market opportunities. During this critical period in our Company’s history, the Compensation Committee believes that retaining and motivating each member of our senior leadership team and staff is essential, and that the various elements of total compensation have worked well to attract, retain and properly reward management for their performance.
COMPENSATION GOVERNANCE
The Role of the Board’s Compensation Committee
The Compensation Committee oversees all aspects of our executive compensation program. The Compensation Committee has responsibility for:
•Establishing compensation policies for our senior leadership team
•Determining the compensation of our CEO
•Reviewing our CEO’s compensation recommendations regarding other members of the senior leadership team and determining appropriate compensation for such persons
Our Board has adopted a Compensation Committee Charter to govern the Compensation Committee’s activities. The charter, which may be found on our website at www.assuredguaranty.com/governance, is reviewed annually by the Compensation Committee. Under its charter, the Compensation Committee is authorized to retain compensation, legal, accounting and other expert consultants at our expense.
The Role of the Independent Consultants
For more than ten years, including in 2021, the Compensation Committee has engaged FW Cook as its independent compensation consultant and considered advice and information from that firm in determining the amount and form of compensation for each member of our senior leadership team. Periodically, the Nominating and Governance Committee also engages FW Cook to conduct a comprehensive review of the compensation package for the independent directors; FW Cook last undertook such a comprehensive review in 2021.
In 2021, FW Cook’s work for the Compensation Committee included analyzing our compensation practices in light of best practices, providing a compensation risk assessment, reviewing and advising us on changes to our comparison group of companies, collecting and providing relevant market data, reviewing data and analyses provided by other consultants, and updating the Compensation Committee with respect to evolving governance trends.
The Compensation Committee has considered the independence of FW Cook in light of SEC rules and NYSE listing standards. It requested and received a letter from FW Cook in 2021 affirming factors relevant to assessing FW Cook’s independence. The Compensation Committee discussed the content of the letter and concluded that FW Cook’s work did not raise any independence or conflict of interest issues.
When the Compensation Committee began to contemplate amending the long-term equity incentive program to include performance restricted share units based on relative TSR performance in 2018, we engaged Aon to model the grant date fair value and ultimate performance and payout of hypothetical Relative TSR PSUs with various characteristics and, once the characteristics of the Relative TSR PSUs were settled, to provide grant date valuation of the Relative TSR PSUs and to provide Relative TSR PSU value tracking over the life of the Relative TSR PSUs. The Compensation Committee engaged Aon as a compensation consultant beginning in 2018 when it established the TSR PSUs in February 2019, and again in 2021 when it considered whether, given changes in the Russell Midcap
60 Assured Guaranty 2022 Proxy Statement
Financial Services Index since 2019, it should change the reference index used for the TSR PSUs (it chose not to make any changes). We also engage Aon to calculate and report on the value of the TSR PSUs on an ongoing basis.
The Compensation Committee has considered the independence of Aon in light of SEC rules and NYSE listing standards. It requested and received a letter from Aon in 2021 affirming factors relevant to assessing Aon's independence. The Compensation Committee discussed the content of the letter and concluded that Aon's work did not raise any independence or conflict of interest issues.
Executive Compensation Comparison Group
The Compensation Committee examines pay data for the following 21 companies to review pay practices, identify compensation trends, and benchmark its executive compensation decisions: | | | | | | | | |
| Affilated Managers Group | Enstar Group Limited | Radian Group |
| Alleghany | Essent Group, Ltd. | RenaissanceRe Holdings |
| AllianceBernstein | Everest Re Group, Ltd. | Sculptor Capital |
| Arch Capital Group | Federated Hermes | Selective Insurance Group, Inc |
| Argo Group International Holdings, Ltd. | First American Financial Corporation | The Hanover Insurance Group, Inc. |
| Assurant, Inc. | Janus Henderson Group | Virtus Investment Partners |
| AXIS Capital Holdings Limited | MGIC Investment Corporation | White Mountains Insurance Group, Inc. |
The Compensation Committee has long recognized that the comparison group has limitations. Our company is the only publicly-traded financial services company primarily writing new financial guaranty business in today’s markets.
Notably, the comparison group consists primarily of mortgage finance and property and casualty insurance and reinsurance companies, along with the six asset managers (reflecting our expansion into asset management). Despite the specialized nature of our primary financial guaranty business, our Compensation Committee looks for companies domiciled in Bermuda or with a similar size, global business model and compensation mix to ours, along with publicly traded asset management companies to reflect the establishment of AssuredIM. Although the factors the Compensation Committee considers for its compensation decisions and the level of compensation may differ from those for the comparison group, the Compensation Committee finds it useful to consider the pay practices at these companies.
In October 2021, FW Cook met with the Compensation Committee to review the comparison group and to discuss whether other companies should be considered for inclusion in the group. Based on FW Cook’s review and the continued importance of the asset management business to our strategic vision, and due to the acquisition of Eaton Vance (which had been one of the 21 companies in the group) by Morgan Stanley on March 1, 2021, FW Cook recommended to the Compensation Committee that it revise the comparison group by replacing Eaton Vance with another asset management company.
In locating a replacement for Eaton Vance, FW Cook searched for an asset manager that was similar to our asset management business, screening for size, business model and presence in a peer network. FW Cook’s recommendation to add AllianceBernstein was accepted by the Compensation Committee. It is indicated in bold in the above list.
FW Cook advised the Compensation Committee that, as of December 31, 2021, our one-year TSR was the highest of the revised comparison group and our three-year TSR ranked somewhat below the median of the revised comparison group. FW Cook also informed the Compensation Committee that, as of September 30, 2021, our latest four quarters of net income was near the 25th percentile of the revised comparison group and our total assets were between the median and the 75th percentile.
The revised comparison group consists of companies that, like our Company, have a business model that involves underwriting or credit risk, a holding company structure, and similar size as measured by revenues, assets and market capitalization.
Executive Officer Recoupment Policy and Related Forfeiture and Termination for Cause Provisions
Our Board of Directors adopted a recoupment (or clawback) policy in February 2009 pursuant to which the Compensation Committee was permitted to rescind or recoup certain compensation awards to an executive officer in the event of a material restatement of our financial results (or for stock options, if such person engaged in misconduct related to a restatement of our financial results), or if that person was awarded or paid certain compensation based on objectively quantifiable performance goals that were later determined to have been overstated. In November 2015, the Compensation Committee amended the recoupment policy so that it would apply, to the extent required by law, to incentive compensation received in the three-year period before a determination that a material restatement of our financial results is required.
In 2021, the Compensation Committee initiated a comprehensive review not only of our recoupment policy, but also the forfeiture and recoupment provisions in the grant agreements for our equity incentive awards (RSUs and PSUs) and non-equity incentive awards, and the definition of cause used in those grant agreements and our executive severance plan. After considering a report from FW Cook on best practices, the Compensation Committee determined that it was in the best interest of our Company to expand and harmonize the circumstances under which the Compensation Committee has discretionary authority to impose forfeiture, recoupment and / or
61 Assured Guaranty 2022 Proxy Statement
termination for cause. In February 2022, the Compensation Committee adopted a revised recoupment policy that expands the circumstances that can trigger recoupment pursuant to the policy to now include misconduct by the executive (now broader than just misconduct related to restatement of financial statements) and that expands the types of compensation awards that are subject to the recoupment policy, and adopted updated grant agreements for equity awards and an updated executive severance plan that now include an expanded definition of cause and that contain provisions requiring recipients to agree that all previously granted awards to such recipient are subject to the updated terms of the amended recoupment policy. The updated definition of cause expands the circumstances that constitute cause, including any acts or omissions by the executive that are likely to injure the operations or reputation of the Company.
The table below presents a simplified summary of selected provisions of the current recoupment policy, severance plan and grant agreements as approved February 2022, and is modified in its entirety by the detailed provisions of such documents, which are or will be filed with the SEC. The provisions summarized below are applicable to each member of our senior leadership team. Conduct, activity or events may fall into more than one category in the table.
| | | | | | | | | | | |
| Forfeit Unpaid Incentive Compensation* | Recoup Already Paid Incentive Compensation* | Termination
for Cause |
| Misconduct: (a) felony; (b) other crime involving moral turpitude in certain circumstances; and (c) other serious misconduct that may cause material harm to our employees or material reputational harm to the Company or may expose the Company to material regulatory, legal or financial risk | ü | ü | ü |
| Any act or omission likely to injure our operations or reputation or to prevent such executive from being able to perform their duties | ü | | ü |
| Material restatement of financial statements (regardless of misconduct) | ü | ü | |
| Overstatement of objectively quantifiable performance objectives | ü | ü | |
| Violation of specified covenants (non-compete, non-solicitation, breach of confidentiality) | ü | ü | ü |
| Failure to follow directions of the Board or supervisor or any willful, serious and continued failure to perform their duties | ü | | ü |
* The covered incentive compensation consists of RSUs, ABV PSUs, TSR PSUs and non-equity incentive compensation (cash).
Share Ownership Guidelines
To demonstrate our commitment to building shareholder value, the Board of Directors adopted management share ownership guidelines. Our guidelines do not mandate a time frame by which this ownership must be attained, but each member of our senior leadership team must retain 100% of their after-tax receipt of our Common Shares until they reach their ownership goal. Please see “Information About Our Common Share Ownership—How Much Stock is Owned by Directors and Executive Officers” for detailed information on the executive officers’ stock ownership.
The chart below shows the guideline for each of our named executive officers and each executive’s stock ownership as of March 11, 2022, the record date, using $57.41, the closing price of one of our Common Shares on the NYSE on such date.
| | | | | | | | | | | |
| Named Executive Officer | Guideline | Current Ownership |
| Dominic J. Frederico | 7 × Salary | 70.2 × Salary | (1) |
| Robert A. Bailenson | 5 × Salary | 17.9 × Salary | |
David A. Buzen(2) | 5 × Salary | 5.8 × Salary | |
Ling Chow (3) | 5 × Salary | 7.4 × Salary | |
| Russell B. Brewer II | 5 × Salary | 20.5 × Salary | |
(1) Common shares beneficially owned by Mr. Frederico include 300,000 shares pledged in accordance with our stock trading policy.
(2) Mr. Buzen became an executive officer in 2020.
(3) Ms. Chow became an executive officer in 2018.
62 Assured Guaranty 2022 Proxy Statement
These ownership levels include shares owned and, in the case of Mr. Bailenson, vested share units credited to his non-qualified retirement plan. Unvested RSUs and unvested PSUs do not count towards the guidelines. Some of the executive officers who have reached their share ownership goals have made gifts of shares to family or to charitable or educational institutions.
Anti-Hedging Policy
We adopted an anti-hedging policy in 2013 that explicitly prohibits employees and directors from hedging our Common Shares.
Anti-Pledging Policy
Our stock trading policy prohibits employees and directors from pledging our Common Shares without the approval of both our General Counsel and the Nominating and Governance Committee. Our stock trading policy requires that, in order to grant such approval, our Nominating and Governance Committee determine that the person making the pledge demonstrates the financial capacity to repay the loan (which does not constitute margin debt) without resorting to the pledged securities. Mr. Frederico has pledged 300,000 of our Common Shares. Even if such shares are excluded from his total, on March 11, 2022, Mr. Frederico owned Common Shares in an amount equal to 56.4x his salary, more than eight times his guideline of 7x his salary. No other director or executive officer has pledged Common Shares.
Award Timing
The Compensation Committee meets during our February board meeting to make executive compensation decisions with respect to the previous year’s performance and to make its compensation recommendations to the other directors. After consulting with the Board, the Compensation Committee approves salary increases (if any), cash incentive compensation, and long-term equity incentive awards for each member of our senior leadership team. Calculations of the number of PSUs and RSUs awarded to each member of our senior leadership team are made as of the date of the decision, which occurs several days prior to the day we file with the SEC our Annual Report on Form 10-K for the previous calendar year. We have consistently followed this timing for many years. The number of units granted is calculated by dividing such value by the average closing price on the NYSE of a Common Share over the 40 consecutive trading days ending on the date of grant. Payments of cash incentives are not made until after we file with the SEC our Annual Report on Form 10-K for the previous calendar year.
63 Assured Guaranty 2022 Proxy Statement
POST-EMPLOYMENT COMPENSATION
Retirement Benefits
We maintain tax-qualified and non-qualified defined contribution retirement plans for each member of our senior leadership team and other eligible employees. We do not maintain any defined benefit pension plans. The Compensation Committee and our management believe that it is important to provide retirement benefits to employees who reach retirement in order to attract and retain key employees. All retirement benefits are more fully described below under “Potential Payments Upon Termination or Change in Control.”
| | | | | |
Benefit Under Defined Contribution Plans | Description |
Core contribution | We contribute 7% of each employee’s salary and non-equity incentive payment or cash bonus compensation, which we refer to as eligible compensation, on the portion made to our tax-qualified plan, and 6% on the portion made to our nonqualified supplemental employee retirement plans. |
Company match | We match 100% of each employee’s contribution, up to 7% of eligible compensation on the portion made to our tax-qualified plan, and 6% on the portion made to our nonqualified supplemental employee retirement plans. |
Severance
Under our severance plan for members of our senior leadership team, following the executive’s involuntary termination without cause or voluntary termination for good reason and subject to the executive signing a release of claims, the executive will receive a lump-sum payment in an amount equal to one year’s salary plus their average cash incentive amount over the preceding three-year period, plus a pro-rata annual cash incentive amount for the year of termination, and an amount equal to one year of medical and dental premiums. The executive’s receipt of severance benefits is subject to their compliance with non-competition, non-solicitation, and confidentiality restrictions during their employment and for a period of one year following termination of employment. We, in our discretion, may choose to pay one year of base salary to an executive who terminates employment for a reason other than involuntary termination without cause or voluntary termination for good reason, in which case the executive will also be subject to non-competition, non-solicitation, and confidentiality restrictions following their termination of employment.
Change In Control Benefits
We provide change in control benefits to encourage members of our senior leadership team to consider the best interests of shareholders by mitigating any concerns about their own personal financial well-being in the face of a change in control of our Company. Based on shareholder input and changing market trends, since 2011, in the event of a change in control:
•Long-term incentive awards will vest only upon certain terminations of employment following a change in control (double-trigger)
•Such awards will vest upon a change in control (single-trigger) if the acquirer does not assume the awards
•We do not provide excise tax reimbursements and gross-up payments in the case of a change in control
Detailed information is provided below under “Potential Payments Upon Termination or Change in Control.”
TAX TREATMENT
Section 162(m) of the Internal Revenue Code limits the deductibility of annual compensation in excess of $1 million paid to “covered employees” of the Company, with some limited exceptions for compensation paid pursuant to certain arrangements in place on November 2, 2017. Our covered employees generally include anyone who (i) was the CEO or CFO at any time during the year, (ii) was one of the other NEOs who was an executive officer as of the last day of the fiscal year, and (iii) was a covered employee for any previous year after 2016.
As with prior years, although the Compensation Committee will consider deductibility under Section 162(m) with respect to the compensation arrangements for executive officers, deductibility will not be the sole factor used in determining levels or methods of compensation. The Compensation Committee considers many factors when designing its compensation arrangements in addition to the deductibility of the compensation, and maintains the flexibility to grant awards or pay compensation amounts that are non-deductible if they believe it is in the best interest of our Company and our shareholders.
Section 409A of the Internal Revenue Code imposes restrictions on nonqualified deferred compensation plans. We maintain deferred compensation plans for the benefit of our employees, including nonqualified deferred compensation plans that provide for employee
64 Assured Guaranty 2022 Proxy Statement
and employer contributions in excess of the IRS defined contribution plan limits. The deferred compensation plans we maintain are intended to be exempt from the requirements of Section 409A or, if not exempt, to satisfy the requirements of Section 409A, and we have reviewed and, where appropriate, have amended each of our deferred compensation plans to meet the requirements.
Finally, Section 457A of the Internal Revenue Code imposes restrictions on nonqualified deferred compensation plans maintained by a nonqualified entity (which generally includes an entity in a jurisdiction that is not subject to U.S. income tax or a comprehensive foreign income tax). The deferred compensation plans we maintain are intended to be exempt from the requirements of Section 457A.
NON-GAAP FINANCIAL MEASURES
This proxy statement references financial measures that are not determined in accordance with U.S. GAAP, and are identified as core, operating, PVP or non-GAAP. Although these non-GAAP financial measures should not be considered substitutes for U.S. GAAP measures, our management and Board consider them important performance indicators and have employed them as well as other factors in determining senior leadership incentive compensation.
We referenced in the Management’s Discussion and Analysis in our Annual Report on Form 10-K for the year ended December 31, 2021 certain of the non-GAAP financial measures we use in this proxy statement. The definitions for those non-GAAP financial measures, which are listed below, and how they may be calculated from the most directly comparable GAAP financial measures, may be found on pages 102 to 106 of our Annual Report on Form 10-K for the year ended December 31, 2021, which is available on our website at www.assuredguaranty.com. •adjusted operating income
•adjusted operating shareholders’ equity
•adjusted book value (ABV)
•PVP or present value of new business production
This proxy also references certain non-GAAP financial measures, which are identified as “core”, that our management and Board also consider important performance indicators and have employed, as well as other factors, in determining the incentive compensation of our senior leadership team. These “core” measures, and how they are calculated from our GAAP financial statements, are as follows:
•Core operating income per diluted share. After making the adjustments to net income attributable to Assured Guaranty Ltd. described on pages 103 to 104 of our Annual Report on Form 10-K, Management’s Discussion and Analysis, Non-GAAP Financial Measures to arrive at adjusted operating income, we subtract the gain (or loss) included in net income related to VIE consolidation, net of the tax provision, and to calculate the per diluted share amount divides the result by the weighted average diluted Common Shares during the period. Our adjusted operating income is shown in the table on page 80 of our Annual Report on Form 10-K, Management’s Discussion and Analysis of Financial Condition and Results of Operations, Executive Summary, Financial Performance of Assured Guaranty, and the gain (or loss) included in net income related to VIE consolidation is shown in the same table as “Other.”
•Core operating shareholders’ equity per share. After making the adjustments to shareholders’ equity attributable to Assured Guaranty Ltd. described on pages 104 to 105 of our Annual Report on Form 10-K, Management’s Discussion and Analysis, Non-GAAP Financial Measures to arrive at non-GAAP operating shareholders’ equity, we subtract the gain (or loss) related to VIE consolidation, net of the tax provision, also disclosed in such section of the Form 10-K, and to calculate the per share amount divide by the number of Common Shares outstanding.
•Core ABV. After making the adjustments to shareholders’ equity attributable to Assured Guaranty Ltd. described on pages 104 to 105 of our Annual Report on Form 10-K, Management’s Discussion and Analysis, Non-GAAP Financial Measures to arrive at adjusted book value (ABV), we subtract the gain (or loss) related to VIE consolidation, net of the tax provision, also disclosed in such section of the Form 10-K, and to calculate the per share amount divide by the number of Common Shares outstanding.
•Core operating ROE. Core operating ROE is calculated as core operating income divided by the average of core operating shareholders’ equity at the beginning and end of the period.
65 Assured Guaranty 2022 Proxy Statement
COMPENSATION COMMITTEE REPORT
The Compensation Committee has reviewed and discussed the Compensation Discussion and Analysis contained in this proxy statement with management and, based on such review and discussion, the Compensation Committee recommended to the Board of Directors that the Compensation Discussion and Analysis be included in our Company’s Annual Report on Form 10-K for the year ended December 31, 2021, and this proxy statement. The foregoing report has been approved by the Compensation Committee.
Thomas W. Jones, Chair
G. Lawrence Buhl
Patrick W.
JonesMichael T. O’Kane
Kenny
66 Assured Guaranty 2022 Proxy Statement
SUMMARY COMPENSATION TABLE
The following table provides compensation information for 2021, 2020 and 2019 for our named executive officers.
| | | | | | | | | | | | | | | | | | | | |
Name and Principal Position | Year | Salary | Stock Awards(1) |
Non-Equity Incentive Plan Compen- sation(2) | All Other Compen- sation(3) | Total |
| Dominic J. Frederico, | 2021 | $1,250,000 | $9,239,643 | $3,454,988 | $591,431 | $14,536,062 |
| President and | 2020 | $1,250,000 | $5,964,855 | $2,979,625 | $682,044 | $10,876,524 |
| Chief Executive Officer | 2019 | $1,250,000 | $6,424,343 | $3,727,000 | $752,127 | $12,153,470 |
| Robert A. Bailenson, | 2021 | $800,000 | $2,078,969 | $2,052,792 | $316,847 | $5,248,608 |
| Chief Financial Officer | 2020 | $800,000 | $1,325,546 | $1,669,360 | $367,904 | $4,162,810 |
| 2019 | $700,000 | $1,606,106 | $1,994,720 | $364,809 | $4,665,635 |
David A. Buzen(4), | 2021 | $800,000 | $1,319,932 | $1,696,480 | $273,314 | $4,089,726 |
| Chief Investment Officer and | 2020 | $612,500 | $662,752 | $1,306,585 | $235,131 | $2,816,968 |
| Head of Asset Management | | | | | | |
| Ling Chow, | 2021 | $600,000 | $1,583,883 | $1,499,994 | $251,905 | $3,935,782 |
| General Counsel | 2020 | $550,000 | $1,016,267 | $1,481,135 | $264,960 | $3,312,362 |
| 2019 | $525,000 | $1,070,695 | $1,769,140 | $236,317 | $3,601,152 |
| Russell B. Brewer II, | 2021 | $550,000 | $1,649,945 | $1,374,995 | $259,055 | $3,833,995 |
| Chief Surveillance Officer | 2020 | $525,000 | $1,016,267 | $1,286,093 | $268,315 | $3,095,675 |
| 2019 | $525,000 | $1,177,776 | $1,548,015 | $284,043 | $3,534,834 |
(1) This column represents the grant date value of performance share unit awards and restricted share unit awards granted in 2021, 2020 and 2019 for 2020, 2019 and 2018 performance, respectively.
(2) This column represents cash incentive compensation for 2021, 2020 and 2019 performance paid in 2022, 2021 and 2020, respectively, plus, in the case of Ms. Chow, the vesting date value of Performance Retention Awards (PRA) granted in 2017 and 2016 that vested on December 31 of 2020 and 2019, respectively, as further described in the table below. Beginning in February 2015, executive officers no longer receive grants of PRA. However, Ms. Chow became an executive officer in 2018 and was granted PRA through February 2017. Her last PRA installment vested on December 31, 2020.
| | | | | | | | |
| 2020 | 2019 |
| Cash Incentive Compensation | $1,292,885 | $1,461,390 |
| PRA Payout | $188,250 | $307,750 |
| Total | $1,481,135 | $1,769,140 |
(3) All Other Compensation for 2021 consists of the benefits set forth in the table below. Contributions to defined contribution retirement plans include contributions with respect to salary and cash incentive compensation. The Miscellaneous category within All Other Compensation includes Bermuda club fees, Bermuda health insurance and anniversary awards.
| | | | | | | | | | | | | | | | | |
| D. Frederico | R. Bailenson | D. Buzen | L. Chow | R. Brewer |
| Employer Contribution to Retirement Plans | $513,079 | $301,847 | $258,314 | $232,670 | $225,855 |
| Bermuda Car Allowance | $20,000 | — | | — | | — | | — | |
| Tax Return Preparation | $20,208 | — | | — | | $4,235 | $11,000 |
| Matching Gift Donations | $15,000 | $15,000 | $15,000 | $15,000 | $14,700 |
| Miscellaneous | $23,144 | — | | — | | — | | $7,500 |
| Total | $591,431 | $316,847 | $273,314 | $251,905 | $259,055 |
(4) Mr. Buzen’s 2020 salary was raised from $500,000 to $800,000 in August 2020 in recognition of the substantially increased responsibility he was assuming when he assumed the role of Chief Investment Officer and Head of Asset Management; his 2020 blended salary is shown here.
67 Assured Guaranty 2022 Proxy Statement
EMPLOYMENT AGREEMENTS
None of our named executive officers currently have any employment agreements with the Company. However, as discussed in “Compensation Discussion and Analysis—Separation Agreement,” Mr. Brewer has entered into a separation agreement with the Company pursuant to which he remains employed by the Company in a non-executive officer position, serving as Senior Advisor to the Chief Executive Officer, for a transition period through December 31, 2022.
PERQUISITE POLICY
Our Company has established a perquisite policy pursuant to which we provide members of the senior leadership team certain perquisites that are not available to employees generally. We believe that perquisites we provide to our senior leadership team, including our named executive officers, meet certain business objectives and that the benefit our Company receives from providing these perquisites significantly outweighs the cost of providing them. We feel these perquisites minimize distractions to members of our senior leadership team, thereby enabling them to perform their responsibilities more efficiently. These include tax preparation, annual executive medical exams (for persons who became executive officers prior to December 31, 2017) and, for members of our senior leadership team located in Bermuda, housing and car allowances, Bermuda club memberships, and family travel stipend. In light of the challenges of the Bermuda market, including travel to and from the island, and the cost of living and maintaining a residence, the Bermuda perquisites are consistent with competitive practices in the Bermuda market and have been necessary for recruitment and retention purposes. Any of these perquisites may be modified by the Compensation Committee without the consent of the executives.
In determining the total compensation payable to our senior leadership team, the Compensation Committee considers perquisites in the context of the total compensation which each member of our senior leadership team is eligible to receive. However, given the fact that perquisites represent a relatively small portion of the total compensation of members of the senior leadership team, the availability of these perquisites does not materially influence the decisions made by the Compensation Committee with respect to other elements of the total compensation to which the members of our senior leadership team are entitled or which they are awarded.
SEVERANCE POLICY
Our Company has adopted a severance plan for our senior leadership team. For further detail, see the discussion in “Compensation Discussion and Analysis—Post-Employment Compensation—Severance” and “Potential Payments Upon Termination or Change of Control—Change-in-Control Severance”. A severance plan enables us to attract and retain top candidates for positions on our senior leadership team and enables us to have good relations with those executives.
EMPLOYEE STOCK PURCHASE PLAN
We maintain a broad based employee stock purchase plan that gives our eligible employees the right to purchase our Common Shares through payroll deductions at a purchase price that reflects a 15% discount to the market price of our Common Shares on the first or last day of the relevant subscription period, whichever is lower. No participant may purchase more than $25,000 worth of Common Shares under this plan in any calendar year. In 2021, Mr. Frederico, Mr. Buzen and two other executive officers participated in the employee stock purchase plan; Mr. Frederico and Mr. Buzen participated to the maximum extent possible.
INDEMNIFICATION AGREEMENTS
We enter into indemnification agreements with our directors and executive officers. These agreements are in furtherance of our Bye-Laws which require us to indemnify our directors and officers for acts done, concurred in or omitted in or about the execution of their duties in their respective offices.
•The indemnification agreements provide for indemnification arising out of specified indemnifiable events, such as events relating to the fact that the indemnitee is or was one of our directors or officers or is or was a director, officer, employee or agent of another entity at our request or relating to anything done or not done by the indemnitee in such a capacity.
•The indemnification agreements provide for advancement of expenses.
•These agreements provide for mandatory indemnification to the extent an indemnitee is successful on the merits. To the extent that indemnification is unavailable, the agreements provide for contribution.
•The indemnification agreements set forth procedures relating to indemnification claims.
•The agreements also provide for maintenance of directors’ and officers’ liability insurance.
68 Assured Guaranty 2022 Proxy Statement
2021 GRANTS OF PLAN-BASED AWARDS
The following table sets forth information concerning grants of plan-based awards for our named executive officers made during 2021.
| | | | | | | | | | | | | | | | | | | | | | | | | | |
| Estimated Future Payouts Under Non-Equity Incentive Plan Awards | Estimated Future Payouts Under Equity Incentive Plan Awards | |
| Name | Grant Date | Target | Maximum | Threshold | Target | Maximum | All Other Stock Awards: Number of Shares of Stock or Units | Grant Date Fair Value of Stock and Option Awards(5) |
| Dominic J. Frederico | Feb. 24, 2021(1) | $2,500,000 | $5,000,000 | — | — | — | — | — |
| | Feb. 24, 2021(2) | — | — | 28,386 | | 56,772 | | 141,930 | | — | $3,409,726 |
| | Feb. 24, 2021(3) | — | — | 28,386 | | 56,772 | | 113,544 | | — | $2,498,536 |
| Feb. 24, 2021(4) | — | — | — | | — | — | | 75,696 | | $3,331,381 |
| Robert A. Bailenson | Feb. 24, 2021(1) | $1,600,000 | $3,200,000 | — | | — | — | | — | — |
| | Feb. 24, 2021(2) | — | — | 6,387 | | 12,774 | | 31,935 | | — | | $767,206 |
| | Feb. 24, 2021(3) | — | — | 6,387 | | 12,774 | | 25,548 | | — | | $562,184 |
| Feb. 24, 2021(4) | — | — | — | | — | | — | | 17,032 | | $749,578 |
| David A. Buzen | Feb. 24, 2021(1) | $1,600,000 | $3,200,000 | — | | — | | — | | — | | — | |
| Feb. 24, 2021(2) | — | — | 4,055 | | 8,110 | | 20,275 | | — | | $487,087 |
| Feb. 24, 2021(3) | — | — | 4,055 | | 8,110 | | 16,220 | | — | | $356,921 |
| Feb. 24, 2021(4) | — | — | — | | — | | — | | 10,814 | | $475,924 |
| Ling Chow | Feb. 24, 2021(1) | $1,200,000 | $2,400,000 | — | | — | | — | | — | | — | |
| | Feb. 24, 2021(2) | — | — | 4,866 | | 9,732 | | 24,330 | | — | | $584,504 |
| | Feb. 24, 2021(3) | — | — | 4,866 | | 9,732 | | 19,464 | | — | | $428,305 |
| Feb. 24, 2021(4) | — | — | — | | — | | — | | 12,976 | | $571,074 |
| Russell B. Brewer II | Feb. 24, 2021(1) | $1,100,000 | $2,200,000 | — | | — | | — | | — | | — | |
| | Feb. 24, 2021(2) | — | — | 5,069 | | 10,138 | | 25,345 | | — | | $608,888 |
| | Feb. 24, 2021(3) | — | — | 5,069 | | 10,138 | | 20,276 | | — | | $446,173 |
| Feb. 24, 2021(4) | — | — | — | — | | — | | 13,517 | | $594,883 |
(1) Represents a grant of a non-equity incentive compensation award. As described in “Compensation Discussion and Analysis—Executive --Compensation Program Structure and Process—Components of Our Executive Compensation Program—Cash Incentive Compensation”, our Compensation Committee uses a formula to award cash incentive compensation in order to enhance the transparency of our process. The amount of cash incentive compensation awarded to each executive is determined based on the extent to which that executive achieves certain pre-established performance targets; 67% is tied to the achievement of six financial performance targets and 33% is tied to the achievement of non-financial objectives. On the February 24, 2021 grant date, our Compensation Committee established a target and maximum cash incentive award for each of our named executive officers, as well as the formula for determining the actual amount of payment to each named executive officer, which may range from zero to such executive’s maximum amount. The target for each of our named executive officers is two times their salary, and each would achieve their maximum amount listed (equal to two times their target) upon receiving the maximum score under our formula of 200%. In February 2022, after applying the formula to each of the named executive officers, the Compensation Committee approved the payments described in the Summary Compensation Table for payment of such non-equity incentive compensation awards.
(2) Represents a TSR performance share unit award. The TSR PSUs will vest at the end of a three-year vesting period based on the company’s total shareholder return compared to the total shareholder return of all companies in the Russell Mid-Cap Financial Services Index, with limited exceptions. The number of TSR PSUs listed in the Threshold column represents the number of TSR PSUs which shall become vested based on achievement of 50% of the performance target (a Company total shareholder return at the 25th percentile relative to the total shareholder return of all companies in the Russell Mid-Cap Financial Services Index); the number of TSR PSUs listed in the Target column represents the number of PSUs which shall become vested based on achievement of 100% of the performance target (a company total shareholder return at the 55th percentile relative to the total shareholder return of all companies in the Russell Mid-Cap Financial Services Index); and the
69 Assured Guaranty 2022 Proxy Statement
number of PSUs listed in the Maximum column represents the number of TSR PSUs which shall become vested based on achievement of 250% of the performance target (a Company total shareholder return at the 95th percentile relative to the total shareholder return of all companies in the Russell Mid-Cap Financial Services Index). If at least 50% of the performance target is not achieved during the performance period, all of the TSR PSUs will be forfeited.
(3) Represents an ABV performance share unit award. The ABV PSUs will vest at the end of a three-year vesting period based on the Company’s growth in core adjusted book value, with limited exceptions. The number of ABV PSUs listed in the Threshold column represents the number of ABV PSUs which shall become vested based on achievement of 50% of the performance target (growth in core adjusted book value of 12%); the number of ABV PSUs listed in the Target column represents the number of ABV PSUs which shall become vested based on achievement of 100% of the performance target (growth in core adjusted book value of 15%); and the number of ABV PSUs listed in the Maximum column represents the number of ABV PSUs which shall become vested based on achievement of 200% of the performance target (growth in core adjusted book value of 18%). If at least 50% of the ABV performance target is not achieved during the performance period, all of the ABV PSUts will be forfeited.
(4) Represents a time-based RSU award. Restrictions lapse on the third anniversary of the grant date of the award, subject to continued employment, with limited exceptions.
(5) This column discloses the aggregate grant date fair market value computed in accordance with U.S. GAAP, which is $60.06 per target share for TSR PSUs, $44.01 per target share for ABV PSUs, and $44.01 per share for the RSUs. For the assumptions used in the valuation, see note 14 to our consolidated financial statements included in our Annual Report on Form 10-K for the year ended December 31, 2021.
70 Assured Guaranty 2022 Proxy Statement
OUTSTANDING EQUITY AWARDS
The following table sets forth the outstanding equity awards held by our named executive officers as of December 31, 2021.
| | | | | | | | | | | | | | | | | | | | |
| Stock Awards |
| Name | Number of
Shares or
Units of
Stock That
Have Not
Vested | Market Value
of Shares or
Units of
Stock That
Have Not
Vested | Equity Incentive
Plan Awards:
Number of
Unearned
Shares, Units or
Other Rights
That Have
Not Vested | Equity Incentive
Plan Awards:
Market or
Payout Value of
Unearned
Shares, Units or
Other Rights
That Have
Not Vested |
| Dominic J. Frederico | 59,850 | (1) | $3,004,470 | — | | — |
| 57,010 | (2) | $2,861,902 | — | | — |
| 75,696 | (3) | $3,799,939 | — | | — |
| 35,749 | (4) | $1,794,600 | — | | — |
| 89,776 | (5) | $4,506,755 | — | | — |
| — | | — | 21,379 | (6) | $1,073,226 |
| — | | — | 21,379 | (7) | $1,073,226 |
| — | | — | 28,386 | (8) | $1,424,977 |
| — | | — | 28,386 | (9) | $1,424,977 |
| Robert A. Bailenson | 14,963 | (1) | $751,143 | — | | — |
| 12,669 | (2) | $635,984 | — | | — |
| 17,032 | (3) | $855,006 | — | | — |
| 8,937 | (4) | $448,637 | — | | — |
| 22,444 | (5) | $1,126,689 | — | | — |
| — | | — | 4,751 | (6) | $238,500 |
| — | | — | 4,751 | (7) | $238,500 |
| — | | — | 6,387 | (8) | $320,627 |
| — | | — | 6,387 | (9) | $320,627 |
| David A. Buzen | 7,481 | (1) | $375,546 | — | | — |
| 6,334 | (2) | $317,967 | — | | — |
| 10,814 | (3) | $542,863 | — | | — |
| 4,469 | (4) | $224,344 | — | | — |
| 11,222 | (5) | $563,344 | — | | — |
| — | | — | 2,376 | (6) | $119,275 |
| — | | — | 2,376 | (7) | $119,275 |
| — | | — | 4,055 | (8) | $203,561 |
| — | | — | 4,055 | (9) | $203,561 |
| Ling Chow | 9,975 | (1) | $500,745 | — | | — |
| 9,713 | (2) | $487,593 | — | | — |
| 12,976 | (3) | $651,395 | — | | — |
| 5,958 | (4) | $299,092 | — | | — |
| 14,962 | (5) | $751,092 | — | | — |
| — | | — | 3,643 | (6) | $182,879 |
| — | | — | 3,643 | (7) | $182,879 |
| — | | — | 4,866 | (8) | $244,273 |
| — | | — | 4,866 | (9) | $244,273 |
| 3,297 | (10) | $165,509 | — | | — |
| Russell B. Brewer II | 10,973 | (1) | $550,845 | — | | — |
| 9,713 | (2) | $487,593 | — | | — |
| 13,517 | (3) | $678,553 | — | | — |
| 6,554 | (4) | $329,011 | — | | — |
| 16,458 | (5) | $826,192 | — | | — |
| — | | — | 3,643 | (6) | $182,879 |
| — | | — | 3,643 | (7) | $182,879 |
| — | | — | 5,069 | (8) | $254,464 |
| — | | — | 5,069 | (9) | $254,464 |
71 Assured Guaranty 2022 Proxy Statement
(1) Represents a time-based RSU award. These units were granted on February 27, 2019, and vested on February 27, 2022.
(2) Represents a time-based RSU award. These units were granted on February 26, 2020, and will vest on February 26, 2023, subject to continued employment, with limited exceptions.
(3) Represents a time-based RSU award. These units were granted on February 24, 2021, and will vest on February 24, 2024, subject to continued employment, with limited exceptions.
(4) Represents a TSR performance share unit award. These units were granted on February 27, 2019, and vested on February 27, 2022, and are based on the Company’s total shareholder return compared to the total shareholder return of all companies in the Russell Mid-Cap Financial Services Index over a three-year period, with limited exceptions.
(5) Represents an ABV performance share unit award. These units were granted on February 27, 2019, and vested on February 27, 2022, and are based on the Company’s growth in core adjusted book value over a three-year period, with limited exceptions.
(6) Represents a TSR performance share unit award. These units were granted on February 26, 2020, and will vest on February 26, 2023 subject to continued employment, with limited exceptions, and achievement of defined performance goals based on the Company’s total shareholder return compared to the total shareholder return of all companies in the Russell Mid-Cap Financial Services Index.
(7) Represents an ABV performance share unit award. These units were granted on February 26, 2020, and will vest on February 26, 2023 subject to continued employment, with limited exceptions, and achievement of defined performance goals based on the Company’s growth in core adjusted book value.
(8) Represents a TSR performance share unit award. These units were granted on February 24, 2021, and will vest on February 24, 2024 subject to continued employment, with limited exceptions, and achievement of defined performance goals based on the Company’s total shareholder return compared to the total shareholder return of all companies in the Russell Mid-Cap Financial Services Index.
(9) Represents an ABV performance share unit award. These units were granted on February 24, 2021, and will vest on February 24, 2024 subject to continued employment, with limited exceptions, and achievement of defined performance goals based on the company’s growth in core adjusted book value.
(10) Represents a time-based RSU award. These units were granted on February 21, 2018, and vested on February 21, 2022.
2021 STOCK VESTED
The following table provides information concerning the vesting of restricted share units granted to our named executive officers during 2021. | | | | | | | | |
| Stock Awards |
| Name | Number of Shares Acquired on Vesting(1) | Value Realized on Vesting(2) |
| Dominic J. Frederico | 230,058 | $9,087,291 |
| Robert A. Bailenson | 60,015 | $2,370,593 |
| David A. Buzen | 30,009 | $1,185,356 |
| Ling Chow | 31,717 | $1,253,087 |
| Russell B. Brewer II | 44,010 | $1,738,395 |
(1) This column represents gross shares vesting, not reduced by shares withheld to pay for personal income tax.
(2) The value of a restricted share upon vesting is the fair market value of the stock on the vesting date. This column represents the value of gross shares vesting, not reduced by shares withheld to pay for personal income tax.
72 Assured Guaranty 2022 Proxy Statement
NON-QUALIFIED DEFERRED COMPENSATION
The following table sets forth information concerning non-qualified deferred compensation of our named executive officers. The amounts set forth in this table include only contributions made and earnings received during 2021 and do not include contributions and earnings with respect to the 2021 non-equity incentive compensation paid in 2022.
| | | | | | | | | | | | | | | | | | | | |
| Name | Executive Contributions in Last FY(1) | Registrant Contributions in Last FY(2) | Aggregate
Withdrawals/
Distributions | Aggregate
Earnings
in Last FY | Aggregate Balance at Last FYE(3) |
| Dominic J. Frederico | $237,206 | $474,412 | — | $3,444,816 | $18,518,759 | (4) |
| Robert A. Bailenson | $131,590 | $263,180 | — | $1,897,277 | $8,536,206 | |
| David A. Buzen | $109,824 | $219,647 | — | $185,001 | $1,564,660 | |
| Ling Chow | $97,002 | $194,003 | — | $558,644 | $3,813,629 | |
| Russell B. Brewer II | $93,594 | $187,188 | — | $170,952 | $6,015,684 | |
(1) The amounts in this column are also included in the Summary Compensation Table, in the Salary column and in the Non-Equity Incentive Plan Compensation column.
(2) The amounts in this column are included in the Summary Compensation Table, in the All Other Compensation column as the employer contribution to the retirement plans.
(3) Of the totals in this column plus, for Mr. Frederico, $12,577,909 distributed on January 6, 2017, the following totals have been previously reported in the Summary Compensation Table for previous years:
| | | | | | | | |
| Name | 2021 Amount | 2020 Amount |
| Dominic J. Frederico | $12,155,812 | $11,308,809 |
| Robert A. Bailenson | $3,273,851 | $2,819,659 |
| David A. Buzen | $258,196 | — |
| Ling Chow | $804,737 | $491,544 |
| Russell B. Brewer II | $2,107,221 | $1,782,936 |
(4) $1,612,387 was assumed from the ACE Limited Supplemental Retirement Plan at our 2004 initial public offering.
POTENTIAL PAYMENTS UPON TERMINATION OR CHANGE IN CONTROL
The following tables quantify the potential payments upon termination that our named executive officers would receive assuming that the relevant termination event had occurred on December 31, 2021. The last table quantifies the potential payments upon an involuntary termination without cause and a change of control that our named executive officers would receive assuming that both the termination without cause and change in control had occurred on December 31, 2021.
TERMINATION DUE TO DEATH OR DISABILITY
| | | | | | | | | | | |
| Name | Unvested
RSUs | Unvested PSUs(1) | Total |
| Dominic J. Frederico | $9,666,311 | $12,396,767 | $22,063,078 |
| Robert A. Bailenson | $2,242,133 | $2,927,503 | $5,169,636 |
| David A. Buzen | $1,236,376 | $1,538,682 | $2,775,058 |
| Ling Chow | $1,805,242 | $2,092,520 | $3,897,762 |
| Russell B. Brewer II | $1,716,991 | $2,209,623 | $3,926,614 |
(1) The value of the PSUs for this table was determined as if the applicable performance period ended on December 31, 2021. The portion of the PSUs which ultimately would become vested may vary from this assumed amount depending on the actual price of our Common Shares through the remainder of the actual performance period and the value of our Common Share on the date of distribution.
73 Assured Guaranty 2022 Proxy Statement
TERMINATION DUE TO RETIREMENT
| | | | | | | | | | | |
| Name | Unvested
RSUs | Unvested PSUs(1) | Total |
| Dominic J. Frederico | $9,507,316 | $21,128,095 | $30,635,411 |
Robert A. Bailenson(2) | — | — | — |
| David A. Buzen | $786,087 | $1,726,632 | $2,512,719 |
Ling Chow(3) | — | — | — |
| Russell B. Brewer II | $1,687,840 | $3,748,489 | $5,436,329 |
(1) The value of the PSUs for this table was determined as if the applicable performance period ended on December 31, 2021. The portion of the PSUs which ultimately would become vested may vary from this assumed amount depending on the actual price of our Common Shares through the remainder of the actual performance period and the value of our Common Share on the date of distribution.
(2) Mr. Bailenson had not reached retirement age by December 31, 2021. Upon retirement, Mr. Bailenson will become partially or fully vested in respect of his unvested RSUs and PSUs.
(3) Ms. Chow had not reached retirement age by December 31, 2021. Upon retirement, Ms. Chow will become partially or fully vested in respect of her unvested RSUs and PSUs.
TERMINATION WITHOUT CAUSE PAYMENTS
| | | | | | | | | | | | | | | | | | | | |
| Name | Salary
Continuation | Cash Incentive
Compensation | Benefits | Unvested
RSUs | Unvested PSUs(1) | Total |
| Dominic J. Frederico | $1,250,000 | $3,506,208 | $53,979 | $9,666,311 | $12,396,767 | $26,873,265 |
| Robert A. Bailenson | $800,000 | $1,871,333 | $36,082 | $2,242,133 | $2,927,503 | $7,877,051 |
| David A. Buzen | $800,000 | $1,106,928 | $36,082 | $1,236,376 | $1,538,682 | $4,718,068 |
| Ling Chow | $600,000 | $1,338,358 | $36,082 | $1,639,733 | $2,092,520 | $5,706,693 |
| Russell B. Brewer II | $550,000 | $1,472,608 | $24,699 | $1,716,991 | $2,209,623 | $5,973,921 |
(1) The value of the PSUs for this table was determined as if the applicable performance period ended on December 31, 2021. The portion of the PSUs which ultimately would become vested may vary from this assumed amount depending on the actual price of our Common Shares through the remainder of the actual performance period and the value of our Common Share on the date of distribution.
CHANGE-IN-CONTROL SEVERANCE
| | | | | | | | | | | | | | | | | | | | |
| Name | Salary
Continuation | Cash Incentive
Compensation | Benefits | Unvested
RSUs | Unvested PSUs(1) | Total |
| Dominic J. Frederico | $1,250,000 | $3,506,208 | $53,979 | $9,666,311 | $19,845,552 | $34,322,050 |
| Robert A. Bailenson | $800,000 | $1,871,333 | $36,082 | $2,242,133 | $4,607,292 | $9,556,840 |
| David A. Buzen | $800,000 | $1,106,928 | $36,082 | $1,236,376 | $2,544,681 | $5,724,067 |
| Ling Chow | $600,000 | $1,338,358 | $36,082 | $1,805,242 | $3,366,105 | $7,145,787 |
| Russell B. Brewer II | $550,000 | $1,472,608 | $24,699 | $1,716,991 | $3,527,905 | $7,292,203 |
(1) For PSUs, the applicable performance period would end on the date of a change in control and the amount which would become vested would be determined based on the performance through such date.
The salary continuation, cash incentive compensation and benefits columns in the Termination Without Cause Payments table and the Change-in-Control Severance table represent amounts that would be payable to each named executive officer under the terms of the severance policy for named executive officers. Under the terms of the policy, each named executive officer receives one year of salary, the average of the last three annual cash incentive compensation amounts, a pro-rata annual cash incentive compensation payment for the year of termination and one year of benefits which represent medical plan and dental plan premiums paid by our Company at the same level as was paid just prior to termination.
For the purpose of these tables, the value of RSUs and PSUs has been determined by multiplying the number of shares that would have become vested on December 31, 2021 based on each applicable termination described above and based on target performance or the actual performance determined as if the performance period ended on such date by the closing price of our Common Shares on December 31, 2021, which was $50.20.
74 Assured Guaranty 2022 Proxy Statement
In addition to the amounts listed in the tables, upon a termination of employment for any of the reasons described above, the executives would be entitled to distributions from the qualified and non-qualified defined contribution retirement plans maintained by the Company and affiliates. For the named executive officers, the aggregate qualified and non-qualified defined contribution retirement account balances as of December 31, 2021 for Mr. Frederico, Mr. Bailenson, Mr. Buzen, Ms. Chow and Mr. Brewer are as follows, respectively: $20,113,506, $12,502,528, $1,969,918, $6,183,358 and $10,155,872. Retirement account balances will be paid upon termination in accordance with the terms of the plans, as described below.
If a named executive officer had been terminated for cause on December 31, 2021, he or she would not have received any severance payments and would have forfeited all unvested RSUs and PSUs, receiving only salary payments through the termination date and vested retirement benefits under our Company’s retirement plans.
Severance payments, vesting of restricted share units and retirement plan contributions assume no subsequent employment after termination. Certain rights to vesting and distributions following retirement or a termination without cause are subject to continued compliance with applicable restrictive covenants and may be forfeited by the executive in the event of a violation of such covenants (and in certain circumstances, the executive may be required to repay certain amounts in the event of a violation of such covenants).
CEO PAY RATIO
In 2021, the annual total compensation of Dominic J. Frederico, our President and Chief Executive Officer was $14,536,062. The annual total compensation of our median employee was $294,410. As a result, the ratio of the annual total compensation of our CEO to our median employee was 49.4 to 1.
We identified the median employee by examining the 2021 annual total compensation for all individuals, excluding our CEO, who were employed by us on December 31, 2021. We included all employees, whether employed on a full-time or part-time basis, and including all employees resident outside of the U.S. We did not make any assumptions, adjustments or estimates with respect to annual total compensation. We annualized the compensation for any full-time employees who were not employed by us for all of 2021. We calculated the total compensation for our CEO and all of our employees excluding our CEO using the same methodology we use to calculate Total Annual Compensation for our named executive officers as set forth in the 2021 Summary Compensation table appearing earlier in this proxy statement.
NON-QUALIFIED RETIREMENT PLANS
All the named executive officers participate in a non-qualified defined contribution retirement plan through an Assured Guaranty employer. These plans generally permit distributions only following a participant’s termination of employment, and each of the plans imposes some additional restrictions on distributions as described below. A change in control under the current provisions of these plans does not entitle a participant to payment. Below is an overview of each plan.
AG US GROUP SERVICES INC. SUPPLEMENTAL EXECUTIVE RETIREMENT PLAN (AGUS SERP)
The AG US Group Services Inc. Supplemental Executive Retirement Plan, which we refer to as the AGUS SERP, is a non-qualified retirement plan for higher-paid employees. Internal Revenue Code provisions, such as the annual limit on employee deferrals, limit the amount of contributions that these employees may make or have made on their behalf to the qualified AG US Group Services Inc. Employee Retirement Plan. Upon reaching the limits imposed by Internal Revenue Code provisions, these employees may contribute up to 6% of eligible compensation to the AGUS SERP. The plan also permits discretionary employer contributions (with the employer matching and core contributions to the AGUS SERP capped at a limit of 6% of eligible compensation).
•A participant does not vest in employer contributions until he or she has completed one year of service, but the participant will vest earlier if he or she dies or attains age 65 while employed by a specified Assured Guaranty employer.
•Distribution of a participant’s account balances will be made as a lump sum. However, a participant may elect to receive payment of their account balances in annual installments over a period not exceeding five years, but only if, at the time of termination, the participant has attained age 55 and completed at least five years of service, and the amount of the participant’s account balances is at least $50,000.
•A participant who is considered to be a specified employee as defined in Section 409A of the Internal Revenue Code and whose payment of benefits begins by reason of termination of employment may not begin to receive such payment until six months after termination of employment.
75 Assured Guaranty 2022 Proxy Statement
INCENTIVE PLANS
All the named executive officers have previously received awards pursuant to our Company’s long-term incentive plan. In 2022, the named executive officers received a grant of PSUs and RSUs for the 2021 performance year as described below. Below is an overview of the plans.
ASSURED GUARANTY LTD. 2004 LONG-TERM INCENTIVE PLAN
The 2004 Long-Term Incentive Plan, as amended, provides for the grant of non-qualified and incentive stock options, stock appreciation rights, full value awards, which include awards such as restricted shares, RSUs or PSUs, and cash incentive awards to employees selected by the Compensation Committee. The Compensation Committee specifies the terms of the award, including the vesting period applicable to the award, at the time it grants the award to the employee, and includes the terms in an award agreement between the employee and our Company.
•PSUs were granted in 2019 through 2022 that will vest at the end of a three-year performance period if certain performance conditions are satisfied (based on growth in core adjusted book value per share relative to a target and on TSR relative to the Index) and if the participant continues to be employed through the end of such three-year period, with limited exceptions as described below.
The participant is entitled to pro-rata vesting of the PSUs in the event of termination prior to the end of the vesting period due to death or disability, an involuntary termination without cause, a voluntary termination for good reason or, a voluntary termination due to retirement, if certain requirements are met and if, and only to the extent that, the performance conditions are satisfied at the end of the applicable performance period. In the event of a change in control, the PSUs vest only to the extent that the performance conditions are satisfied at the time of the change in control and only if the participant remains employed through the end of the three-year performance period, provided, however that the vesting of the PSUs shall be accelerated following such change in control in the event of termination following the change in control but prior to the end of the vesting period due to death or disability, an involuntary termination without cause, a voluntary termination for good reason or in the event that the acquirer does not agree to continue such award following the change in control.
•RSUs were granted from 2019 through 2022 that will vest at the end of a three-year vesting period if the participant remains employed through the end of such period. Such vesting may be accelerated in the event of termination prior to the end of the vesting period due to death or disability or in the event of a change in control where the acquirer does not agree to continue such award following the change in control. Additionally, the participant may remain entitled to continued vesting of such RSUs following an involuntary termination without cause, a voluntary termination for good reason or a voluntary termination due to retirement during the vesting period if certain requirements are met, including the participant signing of a release of claims against our Company and continuing to comply with applicable restrictive covenants.
76 Assured Guaranty 2022 Proxy Statement
EQUITY COMPENSATION PLANS INFORMATION
The following table summarizes our equity compensation plans as of December 31, 2021:
| | | | | | | | | | | |
| Plan category | Number of securities to be issued upon exercise of outstanding options, warrants and rights (a) | Weighted average exercise price of outstanding options, warrants
and rights
(b) | Number of
securities
remaining
available
for future
issuance
under equity
compensation
plans
(excluding
securities
reflected in
column (a))
(c) |
| Equity compensation plans approved by security holders | — | | — | | 8,567,790 (1) |
| Equity compensation plans not approved by security holders | N/A | N/A | N/A |
| TOTAL | — | | — | | 8,567,790 |
(1) Includes 118,495 Common Shares reserved for issuance under the Assured Guaranty Ltd. Employee Stock Purchase Plan. Includes 8,449,295 Common Shares available for stock options, restricted stock awards, RSUs, performance stock options and PSUs reserved for future issuance under the Assured Guaranty Ltd. 2004 Long-Term Incentive Plan. The grants of dividend equivalents of RSUs have reduced the number of shares available for future issuance.
77 Assured Guaranty 2022 Proxy Statement
ADVISORY APPROVAL OF EXECUTIVE COMPENSATION
Our shareholders have the opportunity to cast an advisory (nonbinding) vote to approve the compensation of our named executive officers as disclosed in this proxy statement in accordance with the SEC’s compensation disclosure rules. This vote is being conducted in accordance with the requirements of Section 14A of the Exchange Act and the related rules of the SEC. Proposal No. 2 is Item 2 on the proxy card.
As described in detail under the heading “Executive Compensation—Compensation Discussion and Analysis,” our executive compensation program is designed to attract, motivate, and retain talented executives who possess the skills required to formulate and drive our Company’s strategic direction and achieve annual and long-term performance goals necessary to create shareholder value. The program seeks to align executive compensation with shareholder value on an annual and long-term basis through a combination of base pay, annual incentives and long-term incentives. The Compensation Committee continually reviews the compensation programs for our named executive officers to ensure they achieve the desired goals of aligning our executive compensation structure with our shareholders’ interests and current market practices. Please read the “Compensation Discussion and Analysis” discussion for additional details about our executive compensation programs, including information about the fiscal year
20192021 compensation of our named executive officers.
We believe that our executive compensation programs are structured in the best manner possible to support our Company and our business objectives. We are asking our shareholders to indicate their support for our named executive officer compensation as described on pages
2230 to
6165 of this proxy statement, which include the “Compensation Discussion and Analysis” section and the compensation tables and related narrative disclosure. This proposal, commonly known as a
“say-on-pay” “say-on-pay” proposal, gives our shareholders the opportunity to express their views on our named executive officers’ compensation. This vote is not intended to address any specific item of compensation, but rather the overall compensation of our named executive officers and the philosophy, policies and practices described in this proxy statement.
| | | | | | | | | | | | | | |
| | | The board of directors recommends that you vote “FOR” the following resolution at the Annual General Meeting: | |
“RESOLVED, that the compensation paid to the Company’s named executive officers, as disclosed pursuant to the compensation disclosure rules of the SEC, including the compensation discussion and analysis, the compensation tables and any related material disclosed in this proxy statement, including the Compensation Discussion and Analysis, compensation tables and narrative discussion is hereby APPROVED.”
The
say-on-pay vote is advisory, and therefore not binding on our Company, the Compensation Committee or the Board of Directors. However, the Board of Directors and the Compensation Committee value the opinions of our shareholders and will review the voting results carefully. To the extent there is any significant vote against the named executive officer compensation as disclosed in this proxy statement, we will consider our shareholders’ concerns and the Compensation Committee will evaluate whether any actions are necessary to address those concerns.
67
78 Assured Guaranty 2022 Proxy Statement
APPOINTMENT OF INDEPENDENT AUDITOR
The appointment of our independent auditor is approved annually by our shareholders, who also annually authorize the Board of Directors, acting through its Audit Committee, to set the remuneration for our independent auditor. Proposal No. 3 is Item 3 on the proxy card.
At the recommendation of the Audit Committee, the Board of Directors recommends that shareholders appoint PricewaterhouseCoopers LLP as our independent auditor for the year ending December 31,
20202022, and that shareholders authorize the Board of Directors, acting through its Audit Committee, to set the fees for our independent auditor. In making its recommendation with respect to the engagement of our independent auditor, the Audit Committee reviewed both the audit scope and estimated fees for professional services for the coming year.
PwC served as our independent auditor for the year ended December 31,
2019.2021. Our audited financial statements for the year ended December 31,
20192021 will be presented at the Annual General Meeting. Representatives of PwC will attend the Annual General Meeting and will have an opportunity to make a statement if they wish. They will also be available to answer questions at the meeting.
INDEPENDENT AUDITOR FEE INFORMATION
The following table presents fees for professional audit services rendered by PwC for the audit of our annual consolidated financial statements for
20192021 and
20182020 and fees for other services rendered by PwC in
20192021 and
2018. | | | | | | | | |
| | | |
| | | 2019 | | | 2018 | |
| | |
Audit fees(1) | | $ | 7,906,500 | | | $ | 6,610,000 | |
| | |
Audit-related fees(2) | | $ | 2,285,000 | | | $ | 678,000 | |
| | |
Tax fees(3) | | $ | 250,000 | | | $ | 165,000 | |
| | |
All other fees(4) | | $ | 494,000 | | | $ | 35,000 | |
(1) | We paid audit fees, including costs, for the years ended December 31, 2019 and December 31, 2018 for professional services rendered in connection with:
|
2020. | | | | | | | | |
| 2021 | 2020 |
Audit fees(1) | $9,064,000 | $9,212,000 |
Audit-related fees(2) | $855,000 | $1,428,000 |
Tax fees(3) | $332,000 | $250,000 |
| All other fees | $4,000 | $4,000 |
(1) We paid audit fees, including costs, for the years ended December 31, 2021, and December 31, 2020, for professional services rendered in connection with:
•the audits of our consolidated financial statements, of management’s assessment of internal controls over financial reporting and of the effectiveness of these controls
•the statutory and GAAP audits of various subsidiaries
•review of quarterly financial statements
(2) | Audit-related fees for the year ended December 31, 2019 related to due diligence services for potential acquisitions and potential investments by funds managed by the Company, consultations for proposed accounting standards, audits of our employee benefit plans, audit procedures not required by statute or regulation, agreed upon procedures related to our proxy statement, and agreed upon procedures related to collateralized loan obligations.
|
| Audit-related fees for the year ended December 31, 2018 related to due diligence services for potential acquisitions, consultations for proposed accounting standards, audits of our employee benefit plans, audit procedures not required by statute or regulation, and agreed upon procedures related to our proxy statement.
|
(3) | Of the total amount of tax fees for 2019 and 2018, all fees related to tax compliance. Compliance-related tax fees for 2019 and 2018 were for professional services rendered in connection with the preparation of the 2018 and 2017 federal tax returns.
|
(4) | Fees for 2019 primarily related to advice and consultations regarding laws, rules and regulations in global jurisdictions.
|
•SEC registration statements
(2) Audit-related fees for the years ended December 31, 2021 and December 31, 2020 related to due diligence services for potential acquisitions and potential investments by funds managed by the Company, audits of our employee benefit plans, audit procedures not required by statute or regulation, agreed upon procedures related to our proxy statement, and agreed upon procedures related to collateralized loan obligations.
(3) Of the total amount of tax fees for 2020, all fees related to tax compliance, while fees for 2021 related to both tax compliance and tax consulting. Compliance-related tax fees for 2021 and 2020 were for professional services rendered in connection with the preparation of the 2020 and 2019 federal tax returns. Tax consulting fees for 2021 were for transfer pricing services and other professional services.
PwC also provides audit services to certain unconsolidated funds managed and advised by Assured Guaranty Ltd. subsidiaries. Fees related to these audits were
$4.2$4.5 million in
20192021 and are not reflected in the table above.
68
79 Assured Guaranty 2022 Proxy Statement
PRE-APPROVAL POLICY OF AUDIT AND
NON-AUDIT SERVICES
The Audit Committee
pre-approved all of the fees described above. The Audit Committee has adopted policies and procedures for the
pre-approval of all audit and permissible
non-audit services provided by our independent auditor, PwC. The Audit Committee provides a general
pre-approval of certain audit and
non-audit services on an annual basis. The types of services that may be covered by a general
pre-approval include other audit services, audit-related services and permissible
non-audit services. If a type of service is not covered by the Audit Committee’s general
pre-approval, the Audit Committee must review the service on a specific case by case basis and
pre-approve it if such service is to be provided by the independent auditor. Annual audit services engagement terms and fees require specific
pre-approval of the Audit Committee and management and the auditor will report actual fees versus the budget periodically throughout the year by category of service. Any proposed services exceeding
pre-approved costs also require specific
pre-approval by the Audit Committee. For both types of
pre-approval, the Audit Committee will consider whether such services are consistent with the SEC’s rules on auditor independence. Either the Audit Committee
ChairmanChair or the entire Audit Committee must
pre-approve the provision of any significant additional audit fees in excess of the budgeted amount and/or any excess related to
non-audit fees over the budgeted amount. All fees related to internal control work are
pre-approved by the Audit Committee before such services are rendered. The Audit Committee
pre-approved all of the fees described above pursuant to its
pre-approval policies and procedures.
| | | | | | | | | | | | | | |
| | | The board of directors and the Audit Committee recommend that you vote “FOR” the appointment of PwC as the Company’s independent auditor for the year ending December 31, 20202022, and the authorization of the board of directors, acting through its Audit Committee, to set the fees for the independent auditor. | |
69
80 Assured Guaranty 2022 Proxy Statement
PROPOSALS CONCERNING OUR SUBSIDIARY, ASSURED GUARANTY RE LTD.
In accordance with AGL’s
Bye-Laws, if AGL is required or entitled to vote at a general meeting of any direct
non-United States subsidiary of AGL, AGL’s directors must refer the matter to the shareholders of AGL and seek authority from AGL’s shareholders for AGL’s representative or proxy to vote in favor of the resolution proposed by the subsidiary. AGL’s directors must cause AGL’s representative or proxy to vote AGL’s shares in the subsidiary pro rata to the votes received at the general meeting of AGL. In addition, AGL’s Board of Directors, in its discretion, may require that the organizational documents of each subsidiary of AGL organized under the laws of a jurisdiction outside the United States contain provisions substantially similar to these provisions. As a consequence, we are proposing that our shareholders authorize AGL to vote in favor of the following matters to be presented at the next annual general meeting of our subsidiary, Assured Guaranty Re Ltd., which we refer to as AG Re.
PROPOSAL 4.1—ELECTION OF AG RE DIRECTORS
We propose that AGL be directed to elect the following
eightnine directors of AG Re: Howard W. Albert, Robert A. Bailenson,
Russell B. Brewer, II, Gary Burnet, Ling Chow, Stephen Donnarumma, Dominic J. Frederico,
Darrin Futter, Jorge Gana, Holly L. Horn and Walter A. Scott, with such persons constituting the entire board of directors of AG Re, to serve for one year terms commencing at the annual general meeting of AG Re. Other than Mr. Scott, each nominee is an officer of AGL or one of its subsidiaries and each, including Mr. Scott, has consented to serve as a director of AG Re without fee if elected. Mr. Scott was entitled to a director’s fee of $5,000 for his service in
2019,2021, but
declined.declined the fee. We do not expect that any of the nominees will become unavailable for election as a director of AG Re, but if any nominees should become unavailable prior to the meeting, proxy cards, whether submitted by telephone, via the Internet or by mail, authorizing the proxies to vote for the nominees will instead be voted for substitute nominees recommended by AG Re’s board of directors. Proposal 4.1 is Item 4A on the proxy card.
| | | | | | | | | | | | | | |
| | | The board of directors recommends that you direct AGL to vote “FOR” each of the nominees. | |
The biographies for these nominees are set forth below:
HowardW. Albert,, age 60,62, has been Chief Risk Officer of AGL since May 2011. Prior to that, he was Chief Credit Officer of AGL from 2004 to April 2011. Mr. Albert joined Assured Guaranty in September 1999 as Chief Underwriting Officer of Capital Re Company, the predecessor to AGC. Before joining Assured Guaranty, he was a Senior Vice President with Rothschild Inc. from February 1997 to August 1999. Prior to that, he spent eight years at Financial Guaranty Insurance Company from May 1989 to February 1997, where he was responsible for underwriting guaranties of asset-backed securities and international infrastructure transactions. Prior to that, he was employed by Prudential Capital, an investment arm of The Prudential Insurance Company of America, from September 1984 to April 1989, where he underwrote investments in asset-backed securities, corporate loans and project financings. Mr. Albert’s experience in risk management, underwriting and credit and his position as the Chief Risk Officer of AGL make him valuable to the Board of Directors of AG Re.
RobertA. Bailenson,, age 53,55, has been the Chief Financial Officer of AGL since June 2011. Mr. Bailenson has been with Assured Guaranty and its predecessor companies since 1990. Mr. Bailenson became Chief Accounting Officer of AGC in 2003, of AGL in May 2005, and of Assured Guaranty Municipal Corp., which we refer to as AGM, in July 2009, and served in such capacities until May 2019. He was Chief Financial Officer and Treasurer of AG Re from 1999 until 2003 and was previously the Assistant Controller of Capital Re Corp., the Company’s predecessor. Mr. Bailenson’s background as the Chief Financial Officer of AGL and as an accountant provides an important perspective to the Board of Directors of AG Re.
Russell B. Brewer II, age 63, has been Chief Surveillance Officer of AGL since November 2009 and Chief Surveillance Officer of AGC and AGM since July 2009 and has also been responsible for information technology at AGL since April 2015. Mr. Brewer has been with AGM since 1986. Mr. Brewer was Chief Risk Management Officer of AGM from September 2003 until July 2009 and Chief Underwriting Officer of AGM from September 1990 until September 2003. Mr. Brewer was also a member of the Executive Management Committee of AGM. He was a Managing Director of
81 Assured Guaranty
Municipal Holdings Inc. from May 1999 until July 2009. From March 1989 to August 1990, Mr. Brewer was Managing Director, Asset Finance Group, of AGM. Prior to joining AGM, Mr. Brewer was an Associate Director of Moody’s Investors Service, Inc.70
2022 Proxy Statement
Mr. Brewer’s risk management and surveillance expertise and his position as the Chief Surveillance Officer of AGL enhance the deliberations of the Board of Directors of AG Re.
Gary Burnet,age 49,51, has been President of AG Re since August 2012, and prior to that he served as the Managing Director—Chief Credit Officer of AG Re from 2006 until his appointment as President. Mr. Burnet also served as the Vice President—Risk Management and Operations of AG Re from 2002 to 2005. Prior to joining our Company, Mr. Burnet’s previous experience included two years at ACE Asset Management, where he was Investment Officer with responsibility for developing and modeling the ACE group’s consolidated investment and insurance credit risk. Prior to ACE Asset Management, he was an Assistant Vice President—Investments at ACE Bermuda. Mr. Burnet trained as a Chartered Accountant with Geoghegan & Co. CA from 1993 to 1996 in Edinburgh Scotland and also worked as an audit senior for Coopers & Lybrand from 1996 to 1998 in Bermuda. As the President of AG Re, Mr. Burnet has the most comprehensive knowledge of its operations, including the key areas of underwriting credit risk, accounting and risk management.
Ling Chow, age 49,51, has been General Counsel and Secretary of AGL since January 1, 2018. She is responsible for legal affairs and corporate governance at the Company, including its litigation and other legal strategies relating to distressed credits, and its corporate, compliance, regulatory and disclosure efforts. She is also responsible for the Company’s human resources function. Ms. Chow began her tenure at the Company in 2002 as a transactional attorney, working on the insurance of structured finance and derivative transactions. She previously served as Deputy General Counsel and Assistant Secretary of AGL from May 2015 and as Assured Guaranty’s U.S. General Counsel from June 2016. Prior to that, Ms. Chow served as Deputy General Counsel of Assured Guaranty’s U.S. subsidiaries in several capacities from 2004. Before joining Assured Guaranty, in 2002, Ms. Chow was an associate at various law firms, most recently Brobeck, Phleger & Harrison LLP, where she was a senior associate responsible for transactional work associated with public and private mergers and acquisitions, venture capital investments and private and public securities offerings. Ms. Chow’s experience as an attorney and her position as the General Counsel of AGL enable her to make valuable contributions as a member of the Board of Directors of AG Re.
Stephen Donnarumma, age 57,59, was appointed as a director of AG Re on September 11, 2012. Mr. Donnarumma has been the Chief Credit Officer of AGC since 2007, of AGM since its 2009 acquisition, and of MAC since its 2012 capitalization. Mr. Donnarumma has been with Assured Guaranty since 1993. Over the past 25 years, Mr. Donnarumma has held a number of positions at Assured Guaranty, including Deputy Chief Credit Officer of AGL, Chief Operating Officer and Chief Underwriting Officer of AG Re, Chief Risk Officer of AGC, and Senior Managing Director, Head of Mortgage and Asset-backed Securities of AGC. Prior to joining Assured Guaranty, Mr. Donnarumma was with Financial Guaranty Insurance Company from 1989 until 1993, where his responsibilities included underwriting domestic and international financial guaranty transactions. Prior to that, he served as a Director of Credit Risk Analysis at Fannie Mae from 1987 until 1989. Mr. Donnarumma was also an analyst with Moody’s Investors Services from 1985 until 1987. Mr. Donnarumma’s experience with credit analysis and risk management, and his position as the Chief Credit Officer of AGM
MAC and AGC, provide important perspective to the Board of Directors of AG Re.
Dominic J. Frederico—See Mr. Frederico’s biography in “Election of Directors—Nominees for Director.” The benefits of his experience described therein with respect to the Board of Directors of AGL also make him valuable as a director of AG Re.
Darrin Futter, age 47, was elected Financial Controller of AG Re and AGRO in 2007, prior to which he worked for Deloitte Ltd. in the Bermuda office and worked as a consultant to AG Re. Mr. Futter has worked in various senior audit roles with Ernst and Young LLP in the U.S. and KPMG in Zimbabwe, where he completed his Articles of Clerkship in 2000. He holds a Bachelor of Accounting Science (Hon.) degree from the University of South Africa and is also a Chartered Accountant and a member of the Institute of Chartered Accountants of Zimbabwe.
Mr. Futter’s extensive audit experience provides an important perspective to the Board of Directors of AG Re.
Jorge Gana, age 51, has been Deputy Chief Risk Officer of AGM and AGC since January 2022, where he is the deputy chair of their Risk Management Committees. Mr. Gana joined Assured Guaranty in 2005 as a Director in structured finance. Over the years, Mr. Gana has held a number of positions at Assured Guaranty, including Managing Director, Structured Finance at AGC, Senior Managing Director of Workouts and Government & Corporate Affairs at AGM and AGC, and chair of AGM's and AGC's Workout Committees. Mr. Gana continues to serve as a voting member of AGM's and AGC's Credit and Workout Committees. Prior to joining Assured Guaranty, Mr. Gana served as a Director of Global Commercial Asset Securitization for XLCA (now Syncora). Prior to XLCA, Mr. Gana worked at Natexis Banques Populaires (now Natixis) and at Banco Santander in global capacities dealing with credit & risk, managing investment portfolios, originating complex transactions, and issuing repackaged debt. Mr. Gana also worked for the Chile Economic Development Agency, NY Office, and as Editor of the Chile Economic Report until 1996.
Mr. Gana’s experience in risk management, credit analysis and workouts and his position as Deputy Chief Risk Officer of AGL provides an important perspective to the Board of Directors of AG Re.
Holly L. Horn, age 61, has been Chief Surveillance Officer of AGM and AGC since January 2022. Prior to that, Ms. Horn served as Chief Surveillance Officer, Public Finance of AGM and AGC, where she was responsible for ongoing surveillance, monitoring and loss mitigation of municipal risks insured by Assured Guaranty across all sectors of the municipal market. She joined AGM in 2003 as a director in the health care underwriting group, where she was responsible for analyzing and recommending the insurability of health care credits. She also served as a director in AGM's health care surveillance group. Ms. Horn began her public finance career at Inova
82 Assured Guaranty 2022 Proxy Statement
Health System, a nationally ranked integrated health care delivery system and subsequently served as a senior manager for the national health care strategy practice at Ernst & Young.
Ms. Horn’s surveillance expertise and her position as the Chief Surveillance Officer of AGM and AGC enhance the deliberations of the Board of Directors of AG Re.
Walter A. Scott, age 82,84, was the ChairmanChair of the AGL Board of Directors from May 2005 until his retirement in May 2013, and a director of AGL from 2004 through 2013. Mr. Scott was Chairman,Chair, President and Chief Executive Officer of ACE from 1991 until his retirement in 1994, and President and Chief Executive Officer of ACE from 1989 to 1991. Subsequent to his retirement he served as a consultant to ACE until 1996. Mr. Scott was a director of ACE from 1989 through May 2005. Prior to joining ACE, Mr. Scott was President and Chief Executive Officer of Primerica’s financial services operations. Mr. Scott currently serves as the Chair of the Board of Wachusett Brewing Company, Inc. and was also the ChairmanChair of Vermont Hard Cider Company, LLC from 2003 until 2012, when that company was sold. Mr. Scott is an Emeritus Trustee of Lafayette College and a founding trustee of the Bermuda Foundation for Insurance Studies. Mr. Scott’s tenure on the AGL Board of Directors and lengthy experience at senior levels in the financial services industry allow him to provide valuable perspective to the Board of Directors of AG Re.
PROPOSAL 4.2—APPOINTMENT OF AG RE AUDITOR We propose that AGL be directed to appoint PwC as the independent auditor of AG Re for the fiscal year ending December 31,
2020,2022, subject to PwC being appointed as our Company’s independent auditor. We expect representatives of PwC to be present at AGL’s Annual General Meeting with an opportunity to make a statement if they wish and to be available to respond to appropriate questions. Proposal 4.2 is Item 4B on the proxy card.
71
The following table presents fees for professional audit services rendered by PwC for the audit of AG Re’s financial statements for 20192021 and 2018.
| | | | | | | | |
| | | |
| | | 2019 | | | 2018 | |
Audit fees | | $ | 89,900 | | | $ | 89,900 | |
Audit—related fees | | | — | | | | — | |
Tax fees | | | — | | | | — | |
All other fees | | | — | | | | — | |
2020.
| | | | | | | | |
| 2021 | 2020 |
| Audit fees | $89,900 | $89,900 |
| Audit—related fees | — | — |
| Tax fees | — | — |
| All other fees | — | — |
The above audit fees are also included in the audit fees shown in “Proposal No. 3: Appointment of Independent Auditor.”
Other Matters.The Board of Directors of AGL does not know of any matter to be brought before the annual general meeting of AG Re that we have not described in this proxy statement. If any other matter properly comes before the annual general meeting of AG Re, AGL’s representative or proxy will vote in accordance with
his or hertheir judgment on such matter.
| | | | | | | | |
| | |
| | The board of directors recommends that you direct AGL to vote “FOR” each of the proposals concerning AGL’s subsidiary, AG Re. |
72
83 Assured Guaranty 2022 Proxy Statement
SHAREHOLDER PROPOSALS FOR
20212023 ANNUAL MEETING
HOW DO I SUBMIT A PROPOSAL FOR INCLUSION IN NEXT YEAR’S PROXY MATERIAL?
If you wish to submit a proposal to be considered for inclusion in the proxy material for the next Annual General Meeting, please send it to the Secretary, Assured Guaranty Ltd., 30 Woodbourne Avenue, Hamilton HM 08, Bermuda. Under the rules of the SEC, proposals must be received no later than November 25, 202023, 2022, and otherwise comply with the requirements of the SEC to be eligible for inclusion in AGL’s 20212023 Annual General Meeting proxy statement and form of proxy.
HOW DO I SUBMIT A PROPOSAL OR MAKE A NOMINATION AT AN ANNUAL GENERAL MEETING?
OurBye-Laws provide that if a shareholder desires to submit a proposal for consideration at an Annual General Meeting, or to nominate persons for election as directors, the shareholder must provide written notice of an intent to make such a proposal or nomination which the Secretary of the Company must receive at our principal executive offices no later than 90 days prior to the anniversary date of the immediately preceding Annual General Meeting. With respect to the 20212023 Annual General Meeting, such written notice must be received on or prior to February 5, 2021.3, 2023. The notice must meet the requirements set forth in ourBye-Laws. Under the circumstances described in, and upon compliance with,Rule 14a-4(c) under the Exchange Act, management proxies would be allowed to use their discretionary voting authority to vote on any proposal with respect to which the foregoing requirements have been met.
73
84 Assured Guaranty 2022 Proxy Statement
INFORMATION ABOUT THE ANNUAL GENERAL MEETING AND VOTING
WHY DID I RECEIVE A NOTICE REGARDING THE AVAILABILITY OF PROXY MATERIALS IN THE MAIL INSTEAD OF A FULL SET OF PROXY MATERIALS?
In accordance with the rules of the SEC, instead of mailing a printed copy of the proxy statement, annual report and other materials (which we refer to as proxy materials) for our Annual General Meeting, we are furnishing proxy materials to shareholders on the Internet by providing a Notice Regarding the Availability of Proxy Materials (which we refer to as a Notice) to inform shareholders when the materials are available on the Internet.
If you receive the Notice by mail, you will not receive a printed copy of the proxy materials unless you specifically request one. Instead, the Notice instructs you on how you may access and review all of our proxy materials, as well as how to submit your proxy, over the Internet.
We will first make available the proxy statement, form of proxy card and 20192021 annual report to shareholders atwww.assuredguaranty.com/annualmeeting. The proxy materials will also be available atwww.proxyvote.com on or about March 25, 202023, 2022 to all shareholders entitled to vote at the Annual General Meeting. You may also request a printed copy of the proxy solicitation materials by any of the following methods: via Internet at www.proxyvote.com; www.proxyvote.com; by telephone at1-800-579-1639; or by sending an e-mail to e-mailsendmaterial@proxyvote.com tosendmaterial@proxyvote.com. Our 20192021 annual report to shareholders will be made available at the same time and by the same methods. If requesting materials bye-mail, please send a blanke-mail with the information that is printed in your Notice in the box marked by the arrow in the subject line. We elected to use electronic notice and access for our proxy materials because we believe it will reduce our printing and mailing costs related to our Annual General
Meeting.Meeting and because it is an environmentally friendly practice.
WHY HAS THIS PROXY STATEMENT BEEN MADE AVAILABLE?
Our Board of Directors is soliciting proxies for use at our Annual General Meeting to be held on May 6, 2020,4, 2022, and any adjournments or postponements of the meeting. The meeting will be held at 1:8:00 p.m.a.m. London Time at 6 Bevis Marks, London, EC3A 7BA, United Kingdom. At this writing, governments continue to adjust various travel and gathering
restrictions in response to the novel Coronavirus responsible forCOVID-19 continues to spread and governments are taking various actions in response. If pandemic. In the event we
postpone or change the date, time or location of our
Annual General Meeting as a result of COVID-19, we will post the revised meeting information on our website at www.assuredguaranty.com/annualmeeting as soon as possible after changing the date, time and location for the postponed meeting. We will also promptly issue a press release that we will make available on our website atwww.assuredguaranty.com/annualmeeting and file with the SEC as definitive additional proxy material. Therefore, prior to and on the date of the Annual General Meeting, please visit our website or the SEC’s website (www.sec.gov) to determine if there has been any changes to the date, time or location of our Annual General Meeting. If you wish to receive a physical copy of any such press release, please contact our Secretary at generalcounsel@agltd.com or (441)279-5725. This proxy statement summarizes the information you need to vote at the Annual General Meeting. You do not need to attend the Annual General Meeting to vote your shares.
WHAT PROPOSALS WILL BE VOTED ON AT THE ANNUAL GENERAL MEETING?
The following proposals are scheduled to be voted on at the Annual General Meeting:
•The election of directors
•An advisory vote to approve the compensation paid to our named executive officers
•The appointment of PwC as our independent auditor for 20202022 and the authorization of our Board of Directors, acting through its Audit Committee, to set the fees for the independent auditor
•The direction of AGL to vote for the election of the directors of, and the appointment of the independent auditor for, our subsidiary AG Re
Our Board of Directors recommends that you vote your shares “FOR” each of the nominees and each of the foregoing proposals.
ARE PROXY MATERIALS AVAILABLE ON THE INTERNET?
Important Notice Regarding the Availability of Proxy Materials for the Annual General Meeting to be Held on Wednesday, May
6, 20204, 2022
Yes. Our proxy statement for the 20202022 Annual General Meeting, form of proxy card and 20192021 annual report to shareholders are available atwww.assuredguaranty.com/annualmeeting. The proxy materials will also be available atwww.proxyvote.com on or about March 25, 202023, 2022, to all shareholders entitled to vote at the Annual General Meeting. 85 Assured Guaranty 2022 Proxy Statement
You can obtain directions to attend the 20202022 Annual General Meeting by contacting Virginia Reynolds at + 44 020 7562 1920 or at vreynolds@agltd.com.
74
March
13, 202011, 2022 is the record date for the Annual General Meeting. If you owned our Common Shares at the close of business on March
13, 2020,11, 2022, you are entitled to vote. On that date,
92,270,24565,691,443 of our Common Shares were outstanding and entitled to vote at the Annual General Meeting, including
40,45544,797 unvested restricted Common Shares. Our Common Shares are our only class of voting stock. On March
13, 2020,11, 2022, the closing price of our Common Shares on the
New York Stock Exchange, which we refer to as the NYSE, was
$34.56.$57.41.
HOW MANY VOTES DO I HAVE?
You have one vote for each of our Common Shares that you owned at the close of business on March
13, 2020.11, 2022.
However, if your shares are considered “controlled shares,” which our
Bye-Laws define generally to include all of our Common Shares directly, indirectly or constructively owned by any person or group of persons, or owned by any “United States person,” as defined in the Internal Revenue Code, and such shares constitute 9.5% or more of our issued Common Shares, the voting rights with respect to your controlled shares will be limited, in the aggregate, to a voting power of approximately 9.5%, pursuant to a formula specified in our
Bye-Laws.The Notice indicates the number of Common Shares you are entitled to vote, without giving effect to the controlled share rule described above.
WHAT IS THE DIFFERENCE BETWEEN HOLDING SHARES AS A SHAREHOLDER OF RECORD AND AS A BENEFICIAL OWNER?
Many
While some of our shareholders are
shareholders of record, many are beneficial owners
since theywho hold their shares through a stockbroker, bank or other
nominee rather than as shareholders of record when they own shares directly in their own name.nominee. As summarized below, there are some differences between shares held of record and those owned beneficially.
•Shareholder of Record.If your shares are held directly, or if your shares are registered directly in your name with our transfer agent, Computershare, because you participate in the Assured Guaranty Employee Stock Purchase Plan, you are the shareholder of record of those shares, and these proxy materials are being sent to you directly. As the shareholder of record, you have the right to grant your voting proxy directly to AGL or to vote in person at the Annual General Meeting. You may vote by telephone or via the Internet as described below under the
heading “Information About the Annual General Meeting and Voting—May I Vote by Telephone or via the Internet?” or you may request a paper copy of the proxy materials and vote your proxy card by mail.
•Beneficial Owner.If your shares are held in a stock brokerage account or by a bank or other nominee, you are considered the beneficial owner of shares held in “street name” and our proxy materials are being forwarded to you
by your broker, bank or other nominee who is considered, with respect to those shares, the shareholder of record. As the beneficial owner, you have the right to direct your broker, bank or other nominee on how to vote your shares and are also invited to attend the Annual General Meeting. However, since you are not the shareholder of record, you may only vote these shares in person at the Annual General Meeting if you follow the instructions described below under the heading “How do I Vote in Person at the Annual General Meeting?” Your broker, bank or other nominee has provided a voting instruction form for you to use in directing your broker, bank or other nominee as to how to vote your shares. You may also vote by telephone or on the Internet as described below under the heading “May I Vote by Telephone or via the Internet?” | | by your broker, bank or other nominee who is considered, with respect to those shares, the shareholder of record. As the beneficial owner, you have the right to direct your broker, bank or other nominee on how to vote your shares and are also invited to attend the Annual General Meeting. However, since you are not the shareholder of record, you may only vote these shares in person at the Annual General Meeting if you follow the instructions described below under the heading “How do I Vote in Person at the Annual General Meeting?” Your broker, bank or other nominee has provided a voting instruction form for you to use in directing your broker, bank or other nominee as to how to vote your shares. You may also vote by telephone or on the Internet as described below under the heading “May I Vote by Telephone or via the Internet?”
|
HOW DO I VOTE BY PROXY IF I AM A SHAREHOLDER OF RECORD?
If you are a shareholder of record and you properly submit your proxy card (by telephone, via the Internet or by mail) so that it is received by us in time to vote, your “proxy” (one of the individuals named on your proxy card) will vote your shares as you have directed. If you sign the proxy card (including electronic signatures in the case of Internet or telephonic voting) but do not make specific choices, your proxy will vote your shares as recommended by our Board of Directors (also referred to as our Board or the Board):
•FOR each nominee for election of directors
•FOR approval, on an advisory basis, of the compensation paid to our named executive officers
•FOR the appointment of PwC as our independent auditor for 20202022 and the authorization of our Board of Directors, acting through its Audit Committee, to set the fees for the independent auditor
•FOR directing AGL to vote for each nominee for election of directors of, and the appointment of the independent auditor for, our subsidiary, AG Re
If any other matter is presented, your proxy will vote in accordance with the best judgment of the individuals named on the proxy card. As of the date of filing this proxy statement, we knew of no matters that needed to be acted on at the Annual General Meeting other than those discussed in this proxy statement.